

정보
-
업무명 : 지구물리 원격탐사 실습 자료 : 아이디엘 HDF 형식인 Terra/MODIS 극궤도 기상 위성 자료를 이용한 지표면 온도 및 해발 고도 가시화
-
작성자 : 이상호
-
작성일 : 2020-03-25
-
설 명 :
-
수정이력 :
내용
[개요]
-
안녕하세요? 기상 연구 및 웹 개발을 담당하고 있는 해솔입니다.
-
대학원 석사 1학기에 배운 지구물리 원격탐사에 대한 실습 내용을 다루고자 합니다.
-
오늘 포스팅에서는 HDF 형식인 Terra/MODIS 극궤도 기상 위성 자료를 이용한 지표면 온도 및 해발 고도 가시화를 소개해 드리고자 합니다.
-
추가로 지구물리 원격탐사에 대한 이론적 배경을 소개한 링크를 보내드립니다.
[강릉원주대 대기환경과학과] 2015년 2학기 전선 지구물리 원격탐사 소개 및 과제물
정보 업무명 : 2015년 2학기 전선 지구물리 원격탐사 소개 및 과제물 작성자 : 이상호 작성일 : 2019-12-20 설 명 : 수정이력 : 내용 [특징] 지구물리 원격탐사 수업에 대한 이해를 돕기위해 작성 [기능] 소개 주..
shlee1990.tistory.com
[특징]
-
HDF 극궤도 기상 위성 자료를 이용하여 정성적으로 가시화하기 위한 도구가 필요하며 이 프로그램은 이러한 목적을 달성하기 위해 고안된 소프트웨어
[기능]
-
Terra/MODIS 극궤도 기상 위성 자료에 대한 위/경도 및 지표면 온도 읽기
-
지표면 온도 가시화 및 이미지 저장
[활용 자료]
-
자료명 : MOD03.A2014309.0230.005.2014309134625.hdf
MOD11_L2.A2014309.0230.005.2014310121006.hdf -
자료 종류 : 위/경도, 지표면 온도
-
확장자 : HDF
-
영역 : 전지구
-
기간 : 2014년 11월 05일 02:30 UTC
-
시간 해상도 : 하루에 2번 관측
-
제공처 : NASA
[사용법]
-
입력 자료를 동일 디렉터리에 위치
-
소스 코드를 실행 (idl -e Visualization_Using_MODIS_Land_Surface_Data)
-
가시화 결과를 확인
[사용 OS]
-
Linux
-
Windows 10
[사용 언어]
-
IDL v8.5
소스 코드
-
해당 작업을 하기 위한 컴파일 및 실행 코드는 IDL로 작성되었으며 가시화를 위한 라이브러리는 CIMSS/SSEC Library를 이용하였습니다.
-
소스 코드는 단계별로 수행하며 상세 설명은 다음과 같습니다.
-
1 단계는 주 프로그램은 작업 경로 설정, HDF 파일 읽기, 변수 전처리하여 메모리상에 저장하고 가시화를 위한 초기 설정합니다.
-
일반적으로 포스트 스크립트 (PS) 형식에서 PNG로 변환하나 오랜 시간이 소요되는 단점이 있습니다. 따라서 2 단계에서는 imagemap를 통해 영상 표출하여 이미지 형식으로 저장합니다.
-
[명세]
-
전역 변수 설정
-
결측값 (fillvnan), 최소값 (small), 그림 창 크기 (nxsize, nysize), 그림 저장 여부 (iop_img), 매핑 시 심볼 크기 (sz1), 위/경도 간격 (latlon_intvl)
-
지표면 온도에 대한 최대/최소값 범위 (minx, maxx), 해발 고도에 대한 최대/최소값 범위 (minx2, maxx2)
-
지상 관측소 (GWNU) 표출 여부 (iop_show_gwnu), 지상 관측소를 기준으로로 MODIS 위/경도의 공간 일치를 위한 반경 설정 (acclation)
-
위/경도 (latbeg, latend, lonbeg, lonend)에 따른 관심 영역 (ROI) 설정 (plotlimit)
-
지상 관측소의 위 경도 설정 (xlat_pt1, xlon_pt1)
-
fillvnan=!values.f_nan
small=1.0e-6

nxsize=800 & nysize=800
iop_img=1
sz1=1.5
latlon_intvl=0.2

;**********************************************************************************************
;**********************************************************************************************
;**********************************************************************************************
;**********************************************************************************************
; Please carefully choose the following scale to examine local temperature variability!!!!!
;**********************************************************************************************
minx=285.0 & maxx=295.0  ; range (color scale) of LST to plot (unit: Kelvin)
minx2=0.0 & maxx2=1000.0 ; range (color scale) of terrain height to plot (unit: meter)
;**********************************************************************************************
;**********************************************************************************************
;**********************************************************************************************
;**********************************************************************************************

;iop_regrd=1 ; set to 1 to do regridding the MODIS Level 2 data
iop_show_gwnu=1 ; set to 1 to show the location of GWNU as an open circle in the map.
acclatlon=0.015 ; match-up accuracy in degreee (lat/lon) (match up between MODIS LST geolocation
                ; and the given GWNU Lat/Lon value.

;#######################################################################
;#######################################################################
;area to make a subset
;latbeg=37.0  & latend=38.0 & lonbeg=128.0 & lonend=129.0
latbeg=37.3  & latend=38.2 & lonbeg=128.1 & lonend=129.2 ; set area to plot (and subset)
;#######################################################################
;#######################################################################
;plotlimit=[min(xlat_mod2d),min(xlon_mod2d),max(xlat_mod2d),max(xlon_mod2d)]
;plotlimit=[36.5,127.5,38.5,129.5]
;plotlimit=[37.0,128.0,38.0,129.0]
plotlimit=[latbeg,lonbeg,latend,lonend]


;#######################################################################
;#######################################################################
xlat_pt1=37.771 & xlon_pt1=128.867 ; Lat/Lon of GWNU, Bldg. N16
xlat_pt1arr=replicate(xlat_pt1,2)
xlon_pt1arr=replicate(xlon_pt1,2)
;#######################################################################
;#######################################################################


;#######################################################################
;#######################################################################
;#######################################################################
; input data path ...

pathdata='C:\SYSTEM\PROG\IDL\LandSkinTemp\' ; input data path (modify this line as needed)
pname=pathdata+'M*D11_L2.A*.hdf'
;#######################################################################
;#######################################################################
;#######################################################################
-
MODIS 파일 설정 및 파일 찾기
;#######################################################################
;#######################################################################
;#######################################################################
; input data path ...
pathdata='C:\SYSTEM\PROG\IDL\LandSkinTemp\' ; input data path (modify this line as needed)
pname=pathdata+'M*D11_L2.A*.hdf'
;#######################################################################
;#######################################################################
;#######################################################################
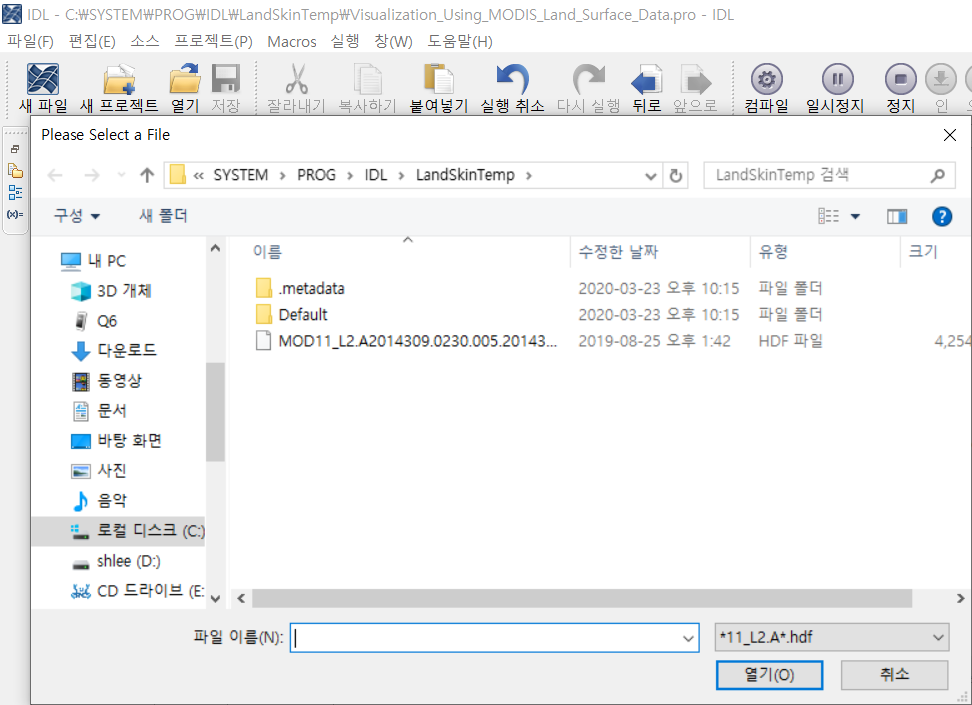
pn_modin=dialog_pickfile(path=pname, filter='*11_L2.A*.hdf') ; open a dialog window box to select input MODIS hdf file/
-
MODIS (MOD11*) 파일 설정 및 파일 찾기
-
dialog_pickfile를 통해 별도의 검색 창에서 지표면 온도 선택
-
; input data path ...
pathdata='C:\SYSTEM\PROG\IDL\LandSkinTemp\' ; input data path (modify this line as needed)
pname=pathdata+'M*D11_L2.A*.hdf'

pn_modin=dialog_pickfile(path=pname, filter='*11_L2.A*.hdf') ; open a dialog window box to select input MODIS hdf file/
-
MODIS (MOD03*) 파일 설정 및 파일 찾기
-
앞서 MOD11* 파일명 패턴을 기준으로 MOD03* 위/경도 파일 찾기
-
fn_modin=strmid(pn_modin,43,44,/reverse_offset)
satidstr=strmid(fn_modin,0,3)
granlstr=strmid(fn_modin,9,13)
;fn_geo='MYD03.A2014314.0430.006.2014314181233.hdf'
;pn_geo=pathdata+fn_geo
fn_geo0=satidstr+'03.'+granlstr+'*.hdf'
pn_geo0=pathdata+fn_geo0
chkgeo=file_search(pn_geo0, count=nchkgeo)


if(nchkgeo gt 0) then begin
   pn_geo=chkgeo[0]
endif else begin  ; if(nchkgeo gt 0) then begin
   print, 'No geolocation file found: '+fn_geo0
  ; stop
endelse           ; if(nchkgeo gt 0) then begin

print, "pn_geo : ", pn_geo
-
출력 파일 (pn_regrddat) 및 이미지 저장 파일 (pn_img*) 설정
pn_regrddat=pathdata+'MODIS_LST_data_regridded.'+satidstr+'.'+granlstr+'.sav'

; output image file names. You may not be able to save output image file
; if you are using unregistered version of IDL.
pn_img0=pathdata+'Visualization_Using_MODIS_Land_Surface_Data'+satidstr+'.'+granlstr+'_img0.png'
pn_img1=pathdata+'Visualization_Using_MODIS_Land_Surface_Data'+satidstr+'.'+granlstr+'_img1.png'
pn_img2=pathdata+'Visualization_Using_MODIS_Land_Surface_Data'+satidstr+'.'+granlstr+'_img2.png'
pn_img3=pathdata+'Visualization_Using_MODIS_Land_Surface_Data'+satidstr+'.'+granlstr+'_img3.png'

print, "pn_modin : ", pn_modin
print, "pn_geo : ", pn_geo

-
HDF 파일 읽기 및 변수 전처리
-
read_single_MOD11_sds 및 read_single_MOD03_geo를 통해 각각 지표면 온도 및 위/경도/고도 변수 선택
-
; begin reading MODIS LSD data from hdf file
;=================================================================================
target_sds_name_in='LST'
read_single_MOD11_sds, pn_modin, target_sds_name_in, ndim_ylst, ylst_mod2d
;=================================================================================
;=================================================================================
target_sds_name_in='Latitude'
read_single_MOD03_geo, pn_geo, target_sds_name_in, ndim_latlon, xlat_mod2d
;=================================================================================
target_sds_name_in='Longitude'
read_single_MOD03_geo, pn_geo, target_sds_name_in, ndim_latlon, xlon_mod2d
;=================================================================================
target_sds_name_in='Height'
read_single_MOD03_geo, pn_geo, target_sds_name_in, ndim_latlon, xhgt_mod2d
;=================================================================================
-
지상 관측소 위/경도를 기준으로 MODIS 격자 찾기
; matching up the given GWNU lat/lon information with MODIS pixel
dist_latlon=sqrt(((xlat_mod2d-xlat_pt1)^2 + (xlon_mod2d-xlon_pt1)^2))
locgwnu=where(dist_latlon eq min(dist_latlon) and dist_latlon le acclatlon, nlocgwnu)
if(nlocgwnu gt 0) then begin
   ylst_gwnu=ylst_mod2d[locgwnu[0]]
endif else begin ; if(nlocgwnu gt 0) then begin
   ylst_gwnu=fillvnan
endelse          ; if(nlocgwnu gt 0) then begin


nxx_mod=ndim_latlon[0] & nyy_mod=ndim_latlon[1]


;++++++++++++++++++++++++++++++++++++++++++++++++++++++++++++++++++++++++++++++++++++
;++++++++++++++++++++++++++++++++++++++++++++++++++++++++++++++++++++++++++++++++++++
;subsetting MODIS data (to effieciently plot small area)
;++++++++++++++++++++++++++++++++++++++++++++++++++++++++++++++++++++++++++++++++++++
;++++++++++++++++++++++++++++++++++++++++++++++++++++++++++++++++++++++++++++++++++++
d1=sqrt((xlat_mod2d-latbeg)^2 + (xlon_mod2d-lonbeg)^2)
d2=sqrt((xlat_mod2d-latend)^2 + (xlon_mod2d-lonend)^2)
loc1=where(d1 eq min(d1))
loc2=where(d2 eq min(d2))
kx1 = loc1[0] mod nxx_mod
ky1 = loc1[0]/nxx_mod
kx2 = loc2[0] mod nxx_mod
ky2 = loc2[0]/nxx_mod
print, kx1, ky1
print, kx2, ky2
lxbeg=min([kx1,kx2]) & lxend=max([kx1,kx2])
lybeg=min([ky1,ky2]) & lyend=max([ky1,ky2])
nyynew=lyend-lybeg+1
nxxnew=lxend-lxbeg+1
zlst=fltarr(nxxnew,nyynew)*fillvnan & zhgt=fltarr(nxxnew,nyynew)*fillvnan
zlat=fltarr(nxxnew,nyynew)*fillvnan & zlon=fltarr(nxxnew,nyynew)*fillvnan
zlst[0:nxxnew-1,0:nyynew-1]=ylst_mod2d[lxbeg:lxend,lybeg:lyend]
zhgt[0:nxxnew-1,0:nyynew-1]=xhgt_mod2d[lxbeg:lxend,lybeg:lyend]
zlat[0:nxxnew-1,0:nyynew-1]=xlat_mod2d[lxbeg:lxend,lybeg:lyend]
zlon[0:nxxnew-1,0:nyynew-1]=xlon_mod2d[lxbeg:lxend,lybeg:lyend]
-
가시화를 위한 초기 설정
-
폰트 설정
-
loadct를 통해 컬러바 설정
-
!p.charsize=1.2
!p.charthick=2.
!p.thick=2.
!p.symsize=3.0
!x.thick=2.
!x.charsize=1.2
!y.thick=2.
!y.charsize=1.2

loadct, 39
-
지표면 온도를 위한 설정 및 가시화
-
imagemap를 통해 위도 (lon), 경도 (lat)에 따른 지표면 온도 (lst) 맵핑
-
oplot를 통해 지상 관측소 매핑
-
saveimage를 통해 png 형식으로 이미지 저장
-
;*************************************
window, 0, xsize=nxsize, ysize=nysize
device, decomposed=0
;*************************************
mag=20


ndivbar=5
ntick=ndivbar+1
nclev=255
delclev = (maxx - minx)/nclev
dtick = (maxx - minx)/ntick
c_levels = delclev*indgen(nclev) + minx
bottom = 1
c_colors = ((!d.table_size -2)/nclev)*indgen(nclev) + bottom
ncolors=n_elements(c_colors)

lat=congrid(zlat, mag*nxxnew,mag*nyynew, /interp)
lon=congrid(zlon, mag*nxxnew,mag*nyynew, /interp)
lst=congrid(zlst, mag*nxxnew,mag*nyynew,/minus_one)

;locfill=where(lst ge maxx-delclev,nlocfill)
;if(nlocfill gt 0) then lst[locfill]=maxx-delclev
;locfill=where(lst le minx+3.*delclev,nlocfill)
;if(nlocfill gt 0) then lst[locfill]=minx+3.*delclev

map_set, limit=plotlimit, /noborder, /isotropic, xmargin=2, ymargin=5

imagemap, lst, lat, lon, range=[minx,maxx], limit=plotlimit, missing=0 $
        , /noborder, /current, /isotropic, position=[.01,.2,.99,.95]

if(iop_show_gwnu eq 1) then oplot, xlon_pt1arr, xlat_pt1arr, psym=psym_circle(), color=255, symsize=sz1

color = !d.table_size -1
map_continents, color=color, /countries, /coasts, /hires
map_grid, color=color, latdel=latlon_intvl, londel=latlon_intvl, charsize=1.2, charthick=2.0, /box_axes ;, /nolabel

colorbar, position=[0.2,0.05,0.8,0.08], range=[minx,maxx] $
        , /horizontal, background=0, color=255, divisions=ndivbar $
        , format='(f6.1)'
if(iop_img eq 1) then saveimage, pn_img0, /png

-
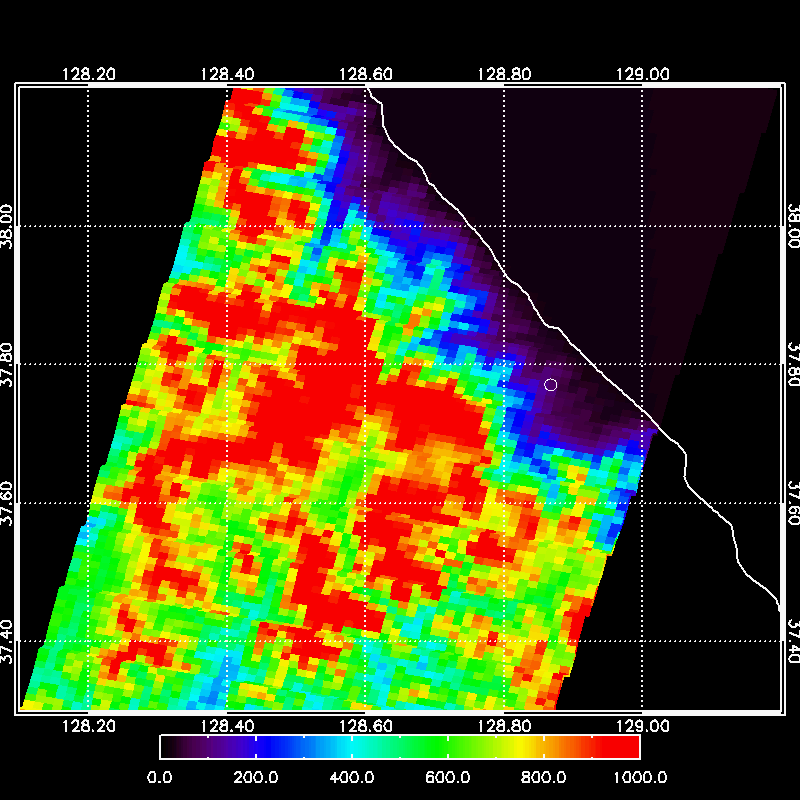
지표면 고도를 위한 설정 및 가시화
-
imagemap를 통해 위도 (lon), 경도 (lat)에 따른 해발 고도 (hgt) 맵핑
-
oplot를 통해 지상 관측소 매핑
-
saveimage를 통해 png 형식으로 이미지 저장
-
;*************************************
window, 1, xsize=nxsize, ysize=nysize
device, decomposed=0
;*************************************

ndivbar=5
ntick=ndivbar+1
nclev=255
delclev = (maxx2 - minx2)/nclev
dtick = (maxx2 - minx2)/ntick
c_levels = delclev*indgen(nclev) + minx2
bottom = 1
c_colors = ((!d.table_size -2)/nclev)*indgen(nclev) + bottom
ncolors=n_elements(c_colors)

hgt=congrid(zhgt, mag*nxxnew,mag*nyynew,/minus_one)

locfill=where(hgt ge maxx2-delclev,nlocfill)
if(nlocfill gt 0) then hgt[locfill]=maxx2-delclev
locfill=where(hgt le minx2+3.*delclev,nlocfill)
if(nlocfill gt 0) then hgt[locfill]=minx2+3.*delclev

map_set, limit=plotlimit, /noborder, /isotropic, xmargin=2, ymargin=5

imagemap, hgt, lat, lon, range=[minx2,maxx2], limit=plotlimit, missing=0 $
        , /noborder, /current, /isotropic, position=[.01,.2,.99,.95]

if(iop_show_gwnu eq 1) then oplot, xlon_pt1arr, xlat_pt1arr, psym=psym_circle(), color=255, symsize=sz1

color = !d.table_size -1
map_continents, color=color, /countries, /coasts, /hires
map_grid, color=color, latdel=latlon_intvl, londel=latlon_intvl, charsize=1.2, charthick=2.0, /box_axes ;, /nolabel

colorbar, position=[0.2,0.05,0.8,0.08], range=[minx2,maxx2] $
        , /horizontal, background=0, color=255, divisions=ndivbar $
        , format='(f6.1)'
if(iop_img eq 1) then saveimage, pn_img1, /png
-
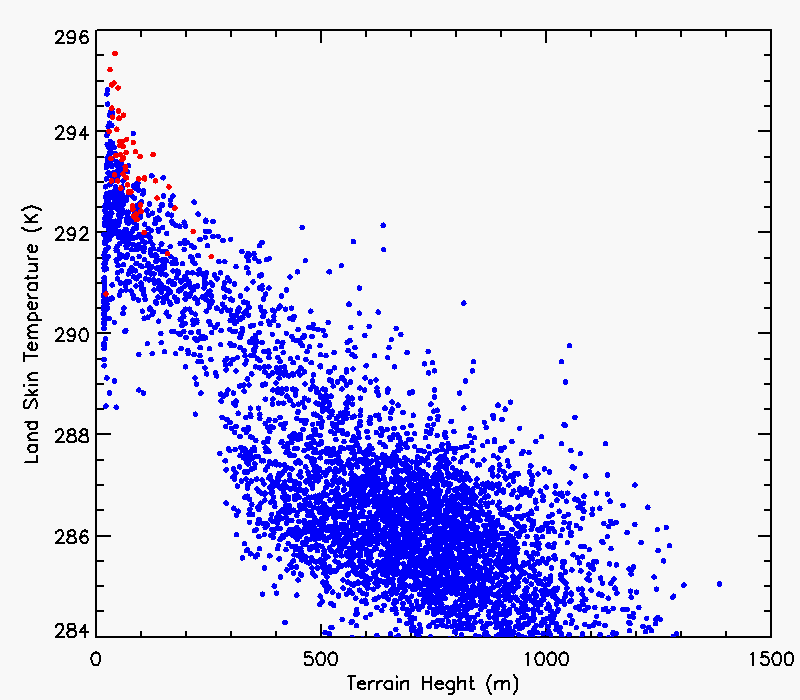
해발 고도 및 온도를 위한 설정 및 가시화
-
plot를 통해 해발 고도 (zhgt), 지표면 온도 (zlst)에 따른 산점도
-
saveimage를 통해 png 형식으로 이미지 저장
-
;*************************************
window, 2, xsize=800, ysize=700
device, decomposed=0
;*************************************
plot, zhgt, zlst, color=0, psym=psym_circle(/fill), symsize=0.7 $
    , background=7, /nodata, xrange=[0.,1500.], yrange=[minx,maxx] $
    , xtitle='Terrain Heght (m)', ytitle='Land Skin Temperature (K)'
oplot, zhgt, zlst, color=6, psym=psym_circle(/fill), symsize=0.7

zdist_latlon=sqrt((zlat-xlat_pt1)^2 + (zlon-xlon_pt1)^2)
radgwnu_reg1=0.05
locgwnureg1=where(zdist_latlon le radgwnu_reg1, nlocgwnureg1)
locgwnuz=where(zdist_latlon eq min(zdist_latlon) and zdist_latlon le acclatlon, nlocgwnuz)

if(nlocgwnureg1 gt 1) then oplot, zhgt[locgwnureg1], zlst[locgwnureg1], color=5, psym=psym_circle(/fill), symsize=0.7
if(nlocgwnuz gt 1) then oplot, replicate(zhgt[locgwnuz[0]],2), replicate(zlst[locgwnuz[0]],2), color=14, psym=1, symsize=1.2

if(iop_img eq 1) then saveimage, pn_img2, /png
-
가시화에 필요한 라이브러리
;##################################################################################
;##################################################################################
pro read_single_MOD03_geo, pn_modin, target_sds_name_in, ndim_target_sds, target_sds
;##################################################################################
;##################################################################################

fillvnan=!values.f_nan
small=1.0e-6
;
;=============================================================================
; open Level 3 MODIS monthly aerosol data - hdf file
;-----------------------------------------------------------------------------
fidmod=hdf_sd_start(pn_modin)
;-----------------------------------------------------------------------------

small=1.0e-6
fillvnan=!values.f_nan

;***************************************
; Target SDS
;***************************************
index =  hdf_sd_nametoindex(fidmod, target_sds_name_in)
sdsid = hdf_sd_select(fidmod, index)
hdf_sd_getinfo, sdsid, name=name, ndims=ndims, natts=natts, dims=dims

ndim_target_sds=dims

   idfill  = hdf_sd_attrfind(sdsid,'_FillValue')
   hdf_sd_attrinfo, sdsid, idfill, data=fillv_modis

   idvrg  = hdf_sd_attrfind(sdsid,'valid_range')
   hdf_sd_attrinfo, sdsid, idvrg, data=vrng_modis

hdf_sd_getdata, sdsid, data
hdf_sd_endaccess, sdsid

target_sds=data
bd=where(abs(data-fillv_modis[0]) le small or data lt vrng_modis[0] or data gt vrng_modis[1],nbd)
if(nbd gt 0) then target_sds[bd]=fillvnan
; conserve memory
data=fillvnan

;=============================================================================
; closing the hdf file & the end of data file access
;-----------------------------------------------------------------------------
hdf_sd_end, fidmod
;=============================================================================

;##################################################################################
return
; The end of subroutine reading selected SDS from MOD11
end
;##################################################################################


;##################################################################################
;##################################################################################
pro read_single_MOD11_sds, pn_modin, target_sds_name_in, ndim_target_sds, target_sds
;##################################################################################
;##################################################################################

fillvnan=!values.f_nan
small=1.0e-6
;
;=============================================================================
; open Level 3 MODIS monthly aerosol data - hdf file
;-----------------------------------------------------------------------------
fidmod=hdf_sd_start(pn_modin)
;-----------------------------------------------------------------------------

small=1.0e-6
fillvnan=!values.f_nan

;***************************************
; Target SDS
;***************************************
index =  hdf_sd_nametoindex(fidmod, target_sds_name_in)
sdsid = hdf_sd_select(fidmod, index)
hdf_sd_getinfo, sdsid, name=name, ndims=ndims, natts=natts, dims=dims

ndim_target_sds=dims

   idfill  = hdf_sd_attrfind(sdsid,'_FillValue')
   hdf_sd_attrinfo, sdsid, idfill, data=fillv_modis

   idscl  = hdf_sd_attrfind(sdsid,'scale_factor')
   hdf_sd_attrinfo, sdsid, idscl, data=sf_modis

   idoff  = hdf_sd_attrfind(sdsid,'add_offset')
   hdf_sd_attrinfo, sdsid, idoff, data=offset_modis

   idvrg  = hdf_sd_attrfind(sdsid,'valid_range')
   hdf_sd_attrinfo, sdsid, idvrg, data=vrng_modis

hdf_sd_getdata, sdsid, data
hdf_sd_endaccess, sdsid

target_sds=sf_modis[0]*data+offset_modis[0]
bd=where(abs(data-fillv_modis[0]) le small or data lt vrng_modis[0] or data gt vrng_modis[1],nbd)
if(nbd gt 0) then target_sds[bd]=fillvnan
; conserve memory
data=fillvnan

;=============================================================================
; closing the hdf file & the end of data file access
;-----------------------------------------------------------------------------
hdf_sd_end, fidmod
;=============================================================================

;##################################################################################
return
; The end of subroutine reading selected SDS from MOD08M3
end
;##################################################################################


pro imagemap, image, lat, lon, newimage = newimage, range = range, $
  limit = limit, position = position, isotropic = isotropic, title = title, $
  xoffset = xoffset, yoffset = yoffset, xsize = xsize, ysize = ysize, $
  missing = missing, noborder = noborder, noerase = noerase, lowres = lowres, $
  current = current

;+
;PURPOSE:
;   Display an image which has latitude and longitude defined for
;   each pixel on a map projection. If a map projection is not currently
;   defined, then a Mercator map projection is created which corresponds to
;   the lat/lon limits of the image.
;
;CALLING SEQUENCE:
;   IMAGEMAP, IMAGE, LAT, LON
;
;INPUT:
;   IMAGE      Array (2D) or vector (1D) of image values
;   LAT        Array or vector of latitudes corresponding to image values
;              (degrees, -90.0 = S, +90.0 = N)
;   LON        Array or vector of longitudes corresponding to image values
;              (degrees, -180.0 = W, +180.0 = E)
;
;OPTIONAL KEYWORDS:
;   NEWIMAGE   Named variable in which resampled image array is returned.
;              Note that this image is always scaled to a BYTE array.
;   RANGE      Range of image values used for brightness scaling, [MIN,MAX]
;              (default is [MIN(IMAGE),MAX(IMAGE)])
;   LIMIT      Limits of map display, [LATMIN,LONMIN,LATMAX,LONMAX]
;              (default is [MIN(LAT),MIN(LON),MAX(LAT),MAX(LON)])
;   POSITION   Normalized coordinates for map display window [X1,Y1,X2,Y2]
;              (default is to let MAP_SET determine the window size)
;              This is useful when used in conjunction with the
;              ESRG BOXPOS procedure. For example,
;              IMAGEMAP, IMAGE, LAT, LON, POS = BOXPOS( /RMARG )
;              will leave room at the right for a COLOR_KEY colorbar.
;   ISOTROPIC  If set, creates an isotropic map projection (default=non-isotropic).
;   TITLE      String variable containing image title (default=no title).
;   XOFFSET    Named variable in which the lower left device X coordinate
;              of the displayed image is returned.
;   YOFFSET    Named variable in which the lower left device Y coordinate
;              of the displayed image is returned.
;   XSIZE      Named variable in which the width of the displayed image
;              is returned (used by devices which have scalable pixels
;              such as Postscript).
;   YSIZE      Named variable in which the height of the displayed image
;              is returned (used by devices which have scalable pixels
;              such as Postscript).
;   MISSING    Byte value to use for missing (unfilled) portions of image
;              (default is zero).
;   NOBORDER   If set, do not draw border around image (default=draw border).
;   NOERASE    If set, do not erase window before creating image (default=erase).
;   LOWRES     If set, draw image in low resolution mode (default=high resolution).
;   CURRENT    If set, use the current map projection.
;
;OUTPUT:
;   The resampled image is displayed in the current graphics window
;   in map coordinates. Continental outlines and lat/lon grids may be
;   overlaid with MAP_CONTINENTS AND MAP_GRID.
;
;CREATED:
;   Liam Gumley, CIMSS/SSEC, 26-JUL-1996
;   liam.gumley@ssec.wisc.edu
;   http://cimss.ssec.wisc.edu/~gumley/index.html
;
;REVISED:
;   Liam Gumley, CIMSS/SSEC, 17-SEP-1996
;   Modified to work with Postscript output.
;   Added XOFFSET, YOFFSET, XSIZE, YSIZE keywords.
;   Mercator map projection is now created only if no map projection exists.
;
;   Liam Gumley, CIMSS/SSEC, 15-OCT-1996
;   Added MISSING keyword to set missing values in image.
;   Added NOBORDER keyword.
;
;   Liam Gumley, CIMSS/SSEC, 25-NOV-1996
;   Now uses MISSING keyword properly.
;   Added NOERASE keyword.
;   Added LOWRES keyword (useful for low resolution images, e.g. HIRS, AMSU).
;
;   Liam Gumley, CIMSS/SSEC, 26-MAR-1999
;   Now uses NOERASE keyword properly.
;
;   Liam Gumley, CIMSS/SSEC, 13-AUG-1999
;   Added CURRENT keyword.
;
;NOTES:
;   (1) Hermann Mannstein (h.mannstein@dlr.de) suggested this IDL method.
;   (2) This has been tested on MAS, AVHRR, GOES, and simulated MODIS data.
;       It will not work well on low resolution data like HIRS or MSU.
;   (3) You might run into problems with data over the poles - I've only
;       tried mid-latitude imagery.
;   (4) This procedure was designed for display purposes *only*.
;       If you use the resampled data for any other purpose, you do so at
;       your own risk.
;   (5) The example takes about 15.6 seconds to execute
;       on a SGI Power Indigo2 (R8000/75MHz) with 256 MB RAM.
;
;EXAMPLE:
;
;; This example is adopted from the ESRG library 'REGRID' procedure.
;; First, create latitude, longitude, and image arrays at 250x200 size.
;;
;c = complex(2,2) + cmplxgen(250,200,/center)/100
;c = c + c^2
;lon = float(c) - 100.0
;lat = 20 + imaginary(c)
;image = sqrt(abs(sin(lon*!pi)*sin(lat*!pi)))^0.3
;;
;; Resize arrays to simulate 1km resolution imagery.
;;
;lat = congrid(lat,1000,800,interp=1)
;lon = congrid(lon,1000,800,interp=1)
;image = congrid(image,1000,800,interp=1)
;;
;; Resample data to Mercator projection, and overlay coastline and grid
;;
;t0 = systime(1.0)
;imagemap,image,lat,lon
;print,'Elapsed time (sec) = ',systime(1.0)-t0
;map_continents
;map_grid
;-

;- check limit keyword

if keyword_set( limit ) then begin
  if n_elements( limit ) ne 4 then $
    message, 'LIMIT must be a 4 element vector of the form [LATMIN,LONMIN,LATMAX,LONMAX]'
  latmin = limit( 0 )
  lonmin = limit( 1 )
  latmax = limit( 2 )
  lonmax = limit( 3 )
endif else begin
  latmin = min( lat, max = latmax )
  lonmin = min( lon, max = lonmax )
endelse

;- check keywords

if not keyword_set( isotropic ) then isotropic = 0
if not keyword_set( noerase ) then noerase = 0

if n_elements( title ) eq 0 then title = ' '
if n_elements( missing ) eq 0 then missing = 0B
missing = byte( ( missing > 0 ) < ( !d.table_size - 1 ) )

;- create Mercator map projection if necessary after checking position keyword

if not keyword_set( current ) then begin
  if n_elements( position ) gt 0 then begin
    if n_elements( position ) ne 4 then $
      message, 'POSITION must be a 4 element vector of the form [X1,Y1,X2,Y2]'
    map_set, /mercator, limit = [ latmin, lonmin, latmax, lonmax ], $
      title = title, isotropic = isotropic, position = position, /noborder, $
      noerase = noerase
  endif else begin
    map_set, /mercator, limit = [ latmin, lonmin, latmax, lonmax ], $
      title = title, isotropic = isotropic, /noborder, $
      noerase = noerase
  endelse
endif

;- compute scaling range for byte image after checking range keyword

if keyword_set( range ) then begin
  if n_elements( range ) ne 2 then $
    message, 'RANGE must be a 2 element vector of the form [MIN,MAX]'
  imin = range( 0 )
  imax = range( 1 )
endif else begin
  imin = min( image, max = imax )
endelse

;- set number of samples and lines for warped image

ns = !d.x_size
nl = !d.y_size
if ( !d.flags and 1 ) then begin
  ns = 640L
  nl = long( float( ns ) * float( !d.y_size ) / float( !d.x_size ) )
endif

;- create resampled byte image

p = convert_coord( lon, lat, /data, /to_normal )
newimage = replicate( 0B, ns, nl )
newimage( p( 0, * ) * ( ns - 1 ), p( 1, * ) * ( nl - 1 ) ) = $
  bytscl( image, min = imin, max = imax, top = !d.table_size - 2 ) + 1B

;- extract portion of image which fits within map boundaries

x = !x.window * ns
y = !y.window * nl
newimage = temporary( newimage( x(0):x(1), y(0):y(1) ) )

;- compute image offset and size (device coordinates)

p = convert_coord( [ x(0), x(1) ] / float( ns ), [ y(0), y(1) ] / float( nl ), $
  /normal, /to_device )
xoffset = p(0,0)
yoffset = p(1,0)
xsize = p(0,1) - p(0,0)
ysize = p(1,1) - p(1,0)

;- fill holes in resampled image

nxr = 2
nyr = 2
if keyword_set( lowres ) then begin
  nxr = 5
  nyr = 5
  if ( !d.flags and 1 ) then begin
    nxr = 7
    nyr = 7
  endif
endif
fill = dilate( newimage, replicate( 1, nxr, nyr ), /gray )
loc = where( ( fill ge 1b ) and ( newimage eq 0 ), count )
if count ge 1 then newimage( loc ) = fill( loc )
fill = 0

;- fill remaining undefined areas of image with the missing value

loc = where( newimage eq 0B, count )
if ( count ge 1 ) and ( missing gt 0B) then newimage( loc ) = missing

;- display resampled image

tv, newimage, xoffset, yoffset, xsize = xsize, ysize = ysize

;- draw map borders

if not keyword_set( noborder ) then begin
  plots, [ p(0,0), p(0,1) ], [ p(1,0), p(1,0) ], /device
  plots, [ p(0,1), p(0,1) ], [ p(1,0), p(1,1) ], /device
  plots, [ p(0,1), p(0,0) ], [ p(1,1), p(1,1) ], /device
  plots, [ p(0,0), p(0,0) ], [ p(1,1), p(1,0) ], /device
endif

end


FUNCTION psym_circle, E, ANGLE, flag= FLAG, radius= RADIUS, fill= FILL
; ANGLE is in degrees
  FILL = Keyword_set( FILL )
  theta = Findgen( 48 ) * 2 * !pi / 47.
  ANGLE = Keyword_set( ANGLE ) ? Float( ANGLE[ 0 ] ) * !pi / 180. : 0.
  If Keyword_set( FLAG ) Then theta = theta + Float( FLAG - 1 ) * !pi / 4.
  While Max( theta ) Ge 2*!pi Do theta[ Where( theta Ge 2*!pi ) ] = theta[ Where( theta Ge 2*!pi ) ] - 2 * !pi
  ;
  If N_elements(   E   ) Eq 0 Then E = 1
  e2 = 1./E^2
  y2 = 1./( tan( theta - ANGLE )^2 + E2 )
  r = Sqrt( 1 + y2 * ( 1 - E2 ) )
  ;
  If Keyword_set( FLAG ) Then Begin
    theta = [ theta[ 0 ], theta ]
    r     = [ 2 * r[ 0 ], r     ]
   Endif
  If Keyword_set( RADIUS ) Then r = r * RADIUS[ 0 ]
  Usersym, r * Sin( theta ), r * Cos( theta ), fill= FILL
  Return, 8
 End


FUNCTION SCREENREAD, X0, Y0, NX, NY, DEPTH=DEPTH

;- Check arguments
if (n_elements(x0) eq 0) then x0 = 0
if (n_elements(y0) eq 0) then y0 = 0
if (n_elements(nx) eq 0) then nx = !d.x_vsize - x0
if (n_elements(ny) eq 0) then ny = !d.y_vsize - y0

;- Check for TVRD capable device
tvrd_true = !d.flags and 128
if (tvrd_true eq 0) then message, $
  'TVRD is not supported on this device: ' + !d.name

;- On devices which support windows, check for open window
win_true = !d.flags and 256
if (win_true gt 0) and (!d.window lt 0) then message, $
  'No graphics window are open'

;- Get IDL version number
version = float(!version.release)

;- Get display depth
depth = 8
if (win_true gt 0) then begin
  if (version ge 5.1) then begin
    device, get_visual_depth=depth
  endif else begin
    if (!d.n_colors gt 256) then depth = 24
  endelse
endif

;- Set decomposed color mode on 24-bit displays
if (depth gt 8) then begin
  entry_decomposed = 0
  if (version gt 5.1) then $
    device, get_decomposed=entry_decomposed
  device, decomposed=1
endif

;- Get the contents of the window
if (depth gt 8) then true = 1 else true = 0
image = tvrd(x0, y0, nx, ny, order=0, true=true)

;- Restore decomposed color mode on 24-bit displays
if (depth gt 8) then device, decomposed=entry_decomposed

;- Return result to caller
return, image

END

PRO SAVEIMAGE, FILE, $
  BMP=BMP, PNG=PNG, GIF=GIF, JPEG=JPEG, TIFF=TIFF, $
  QUALITY=QUALITY, DITHER=DITHER, CUBE=CUBE, QUIET=QUIET

;- Check arguments
if (n_params() ne 1) then $
  message, 'Usage: SAVEIMAGE, FILE'
if (n_elements(file) eq 0) then $
  message, 'Argument FILE is undefined'
if (n_elements(quality) eq 0) then quality = 75

;- Get output file type
output = 'JPEG'
if keyword_set(bmp)  then output = 'BMP'
if keyword_set(png)  then output = 'PNG'
if keyword_set(gif)  then output = 'GIF'
if keyword_set(jpeg) then output = 'JPEG'
if keyword_set(tiff) then output = 'TIFF'

;- Check if GIF output is available
version = float(!version.release)
if (version ge 5.4) and (output eq 'GIF') then $
  message, 'GIF output is not available'

;- Get contents of graphics window,
;- and color table if needed
image = screenread(depth=depth)
if (depth le 8) then tvlct, r, g, b, /get

;- Write 8-bit output file
if (output eq 'BMP') or $
   (output eq 'PNG') or $
   (output eq 'GIF') then begin

  ;- If image depth is 24-bit, convert to 8-bit
  if (depth gt 8) then begin
    case keyword_set(cube) of
      0 : image = color_quan(image, 1, r, g, b, $
            colors=256, dither=keyword_set(dither))
      1 : image = color_quan(image, 1, r, g, b, cube=6)
    endcase
  endif

  ;- Reverse PNG image order if required
  if (output eq 'PNG') and (version le 5.3) then $
    image = reverse(temporary(image), 2)

  ;- Save the image
  case output of
    'BMP'  : write_bmp, file, image, r, g, b
    'PNG'  : write_png, file, image, r, g, b
    'GIF'  : write_gif, file, image, r, g, b
  endcase

endif

;- Write 24-bit output file
if (output eq 'JPEG') or $
   (output eq 'TIFF') then begin

  ;- Convert 8-bit image to 24-bit
  if (depth le 8) then begin
    info = size(image)
    nx = info[1]
    ny = info[2]
    true = bytarr(3, nx, ny)
    true[0, *, *] = r[image]
    true[1, *, *] = g[image]
    true[2, *, *] = b[image]
    image = temporary(true)
  endif

  ;- Reverse TIFF image order
  if (output eq 'TIFF') then $
    image = reverse(temporary(image), 3)

  ;- Write the image
  case output of
    'JPEG' : write_jpeg, file, image, $
               true=1, quality=quality
    'TIFF' : write_tiff, file, image, 1
  endcase

endif

;- Report to user
if (keyword_set(quiet) eq 0) then $
  print, file, output, $
    format='("Created ",a," in ",a," format")'

END


;+
; NAME:
;   COLORBAR
;
; PURPOSE:
;
;       The purpose of this routine is to add a color bar to the current
;       graphics window.
;
; AUTHOR:
;
;   FANNING SOFTWARE CONSULTING
;   David Fanning, Ph.D.
;   1645 Sheely Drive
;   Fort Collins, CO 80526 USA
;   Phone: 970-221-0438
;   E-mail: davidf@dfanning.com
;   Coyote's Guide to IDL Programming: http://www.dfanning.com/
;
; CATEGORY:
;
;       Graphics, Widgets.
;
; CALLING SEQUENCE:
;
;       COLORBAR
;
; INPUTS:
;
;       None.
;
; KEYWORD PARAMETERS:
;
;       BOTTOM:       The lowest color index of the colors to be loaded in
;                     the bar.
;
;       CHARSIZE:     The character size of the color bar annotations. Default is 1.0.
;
;       COLOR:        The color index of the bar outline and characters. Default
;                     is !P.Color..
;
;       DIVISIONS:     The number of divisions to divide the bar into. There will
;                     be (divisions + 1) annotations. The default is 6.
;
;       FONT:         Sets the font of the annotation. Hershey: -1, Hardware:0, True-Type: 1.
;
;       FORMAT:       The format of the bar annotations. Default is '(I5)'.
;
;       INVERTCOLORS: Setting this keyword inverts the colors in the color bar.
;
;       MAXRANGE:     The maximum data value for the bar annotation. Default is
;                     NCOLORS.
;
;       MINRANGE:     The minimum data value for the bar annotation. Default is 0.
;
;       MINOR:        The number of minor tick divisions. Default is 2.
;
;       NCOLORS:      This is the number of colors in the color bar.
;
;       POSITION:     A four-element array of normalized coordinates in the same
;                     form as the POSITION keyword on a plot. Default is
;                     [0.88, 0.10, 0.95, 0.90] for a vertical bar and
;                     [0.10, 0.88, 0.90, 0.95] for a horizontal bar.
;;
;       RANGE:        A two-element vector of the form [min, max]. Provides an
;                     alternative way of setting the MINRANGE and MAXRANGE keywords.
;
;       RIGHT:        This puts the labels on the right-hand side of a vertical
;                     color bar. It applies only to vertical color bars.
;
;       TICKNAMES:    A string array of names or values for the tick marks.
;
;       TITLE:        This is title for the color bar. The default is to have
;                     no title.
;
;       TOP:          This puts the labels on top of the bar rather than under it.
;                     The keyword only applies if a horizontal color bar is rendered.
;
;       VERTICAL:     Setting this keyword give a vertical color bar. The default
;                     is a horizontal color bar.
;
; COMMON BLOCKS:
;
;       None.
;
; SIDE EFFECTS:
;
;       Color bar is drawn in the current graphics window.
;
; RESTRICTIONS:
;
;       The number of colors available on the display device (not the
;       PostScript device) is used unless the NCOLORS keyword is used.
;
; EXAMPLE:
;
;       To display a horizontal color bar above a contour plot, type:
;
;       LOADCT, 5, NCOLORS=100
;       CONTOUR, DIST(31,41), POSITION=[0.15, 0.15, 0.95, 0.75], $
;          C_COLORS=INDGEN(25)*4, NLEVELS=25
;       COLORBAR, NCOLORS=100, POSITION=[0.15, 0.85, 0.95, 0.90]
;
; MODIFICATION HISTORY:
;
;       Written by: David W. Fanning, 10 JUNE 96.
;       10/27/96: Added the ability to send output to PostScript. DWF
;       11/4/96: Substantially rewritten to go to screen or PostScript
;           file without having to know much about the PostScript device
;           or even what the current graphics device is. DWF
;       1/27/97: Added the RIGHT and TOP keywords. Also modified the
;            way the TITLE keyword works. DWF
;       7/15/97: Fixed a problem some machines have with plots that have
;            no valid data range in them. DWF
;       12/5/98: Fixed a problem in how the colorbar image is created that
;            seemed to tickle a bug in some versions of IDL. DWF.
;       1/12/99: Fixed a problem caused by RSI fixing a bug in IDL 5.2. Sigh... DWF.
;       3/30/99: Modified a few of the defaults. DWF.
;       3/30/99: Used NORMAL rather than DEVICE coords for positioning bar. DWF.
;       3/30/99: Added the RANGE keyword. DWF.
;       3/30/99: Added FONT keyword. DWF
;       5/6/99: Many modifications to defaults. DWF.
;       5/6/99: Removed PSCOLOR keyword. DWF.
;       5/6/99: Improved error handling on position coordinates. DWF.
;       5/6/99. Added MINOR keyword. DWF.
;       5/6/99: Set Device, Decomposed=0 if necessary. DWF.
;       2/9/99: Fixed a problem caused by setting BOTTOM keyword, but not NCOLORS. DWF.
;       8/17/99. Fixed a problem with ambiguous MIN and MINOR keywords. DWF
;       8/25/99. I think I *finally* got the BOTTOM/NCOLORS thing sorted out. :-( DWF.
;       10/10/99. Modified the program so that current plot and map coordinates are
;            saved and restored after the colorbar is drawn. DWF.
;       3/18/00. Moved a block of code to prevent a problem with color decomposition. DWF.
;       4/28/00. Made !P.Font default value for FONT keyword. DWF.
;       9/26/00. Made the code more general for scalable pixel devices. DWF.
;       1/16/01. Added INVERTCOLORS keyword. DWF.
;       5/11/04. Added TICKNAME keyword. DWF.
;-
;
;###########################################################################
;
; LICENSE
;
; This software is OSI Certified Open Source Software.
; OSI Certified is a certification mark of the Open Source Initiative.
;
; Copyright � 2000-2004 Fanning Software Consulting.
;
; This software is provided "as-is", without any express or
; implied warranty. In no event will the authors be held liable
; for any damages arising from the use of this software.
;
; Permission is granted to anyone to use this software for any
; purpose, including commercial applications, and to alter it and
; redistribute it freely, subject to the following restrictions:
;
; 1. The origin of this software must not be misrepresented; you must
;    not claim you wrote the original software. If you use this software
;    in a product, an acknowledgment in the product documentation
;    would be appreciated, but is not required.
;
; 2. Altered source versions must be plainly marked as such, and must
;    not be misrepresented as being the original software.
;
; 3. This notice may not be removed or altered from any source distribution.
;
; For more information on Open Source Software, visit the Open Source
; web site: http://www.opensource.org.
;
;###########################################################################


PRO COLORBAR, BOTTOM=bottom, CHARSIZE=charsize, COLOR=color, DIVISIONS=divisions, $
   FORMAT=format, POSITION=position, MAXRANGE=maxrange, MINRANGE=minrange, NCOLORS=ncolors, $
   TITLE=title, VERTICAL=vertical, TOP=top, RIGHT=right, MINOR=minor, $
   RANGE=range, FONT=font, TICKLEN=ticklen, _EXTRA=extra, INVERTCOLORS=invertcolors, $
   TICKNAMES=ticknames

   ; Return to caller on error.

On_Error, 2

   ; Save the current plot state.

bang_p = !P
bang_x = !X
bang_Y = !Y
bang_Z = !Z
bang_Map = !Map

   ; Are scalable pixels available on the device?

IF (!D.Flags AND 1) NE 0 THEN scalablePixels = 1 ELSE scalablePixels = 0

   ; Which release of IDL is this?

thisRelease = Float(!Version.Release)

    ; Check and define keywords.

IF N_ELEMENTS(ncolors) EQ 0 THEN BEGIN

   ; Most display devices to not use the 256 colors available to
   ; the PostScript device. This presents a problem when writing
   ; general-purpose programs that can be output to the display or
   ; to the PostScript device. This problem is especially bothersome
   ; if you don't specify the number of colors you are using in the
   ; program. One way to work around this problem is to make the
   ; default number of colors the same for the display device and for
   ; the PostScript device. Then, the colors you see in PostScript are
   ; identical to the colors you see on your display. Here is one way to
   ; do it.

   IF scalablePixels THEN BEGIN
      oldDevice = !D.NAME

         ; What kind of computer are we using? SET_PLOT to appropriate
         ; display device.

      thisOS = !VERSION.OS_FAMILY
      thisOS = STRMID(thisOS, 0, 3)
      thisOS = STRUPCASE(thisOS)
      CASE thisOS of
         'MAC': SET_PLOT, thisOS
         'WIN': SET_PLOT, thisOS
         ELSE: SET_PLOT, 'X'
      ENDCASE

         ; Here is how many colors we should use.

      ncolors = !D.TABLE_SIZE
      SET_PLOT, oldDevice
    ENDIF ELSE ncolors = !D.TABLE_SIZE
ENDIF
IF N_ELEMENTS(bottom) EQ 0 THEN bottom = 0B
IF N_ELEMENTS(charsize) EQ 0 THEN charsize = 1.0
IF N_ELEMENTS(format) EQ 0 THEN format = '(I5)'
IF N_ELEMENTS(color) EQ 0 THEN color = !P.Color
IF N_ELEMENTS(minrange) EQ 0 THEN minrange = 0
IF N_ELEMENTS(maxrange) EQ 0 THEN maxrange = ncolors
IF N_ELEMENTS(ticklen) EQ 0 THEN ticklen = 0.2
IF N_ELEMENTS(minor) EQ 0 THEN minor = 2
IF N_ELEMENTS(range) NE 0 THEN BEGIN
   minrange = range[0]
   maxrange = range[1]
ENDIF
IF N_ELEMENTS(divisions) EQ 0 THEN divisions = 6
IF N_ELEMENTS(font) EQ 0 THEN font = !P.Font
IF N_ELEMENTS(title) EQ 0 THEN title = ''

; You can't have a format set *and* use ticknames.
IF N_ELEMENTS(ticknames) NE 0 THEN format = ""

IF KEYWORD_SET(vertical) THEN BEGIN
   bar = REPLICATE(1B,20) # BINDGEN(ncolors)
   IF Keyword_Set(invertcolors) THEN bar = Reverse(bar, 2)
   IF N_ELEMENTS(position) EQ 0 THEN BEGIN
      position = [0.88, 0.1, 0.95, 0.9]
   ENDIF ELSE BEGIN
      IF position[2]-position[0] GT position[3]-position[1] THEN BEGIN
         position = [position[1], position[0], position[3], position[2]]
      ENDIF
      IF position[0] GE position[2] THEN Message, "Position coordinates can't be reconciled."
      IF position[1] GE position[3] THEN Message, "Position coordinates can't be reconciled."
   ENDELSE
ENDIF ELSE BEGIN
   bar = BINDGEN(ncolors) # REPLICATE(1B, 20)
   IF Keyword_Set(invertcolors) THEN bar = Reverse(bar, 1)
   IF N_ELEMENTS(position) EQ 0 THEN BEGIN
      position = [0.1, 0.88, 0.9, 0.95]
   ENDIF ELSE BEGIN
      IF position[3]-position[1] GT position[2]-position[0] THEN BEGIN
         position = [position[1], position[0], position[3], position[2]]
      ENDIF
      IF position[0] GE position[2] THEN Message, "Position coordinates can't be reconciled."
      IF position[1] GE position[3] THEN Message, "Position coordinates can't be reconciled."
   ENDELSE
ENDELSE

   ; Scale the color bar.

 bar = BYTSCL(bar, TOP=(ncolors-1 < (255-bottom))) + bottom

   ; Get starting locations in NORMAL coordinates.

xstart = position(0)
ystart = position(1)

   ; Get the size of the bar in NORMAL coordinates.

xsize = (position(2) - position(0))
ysize = (position(3) - position(1))

   ; Display the color bar in the window. Sizing is
   ; different for PostScript and regular display.

IF scalablePixels THEN BEGIN

   TV, bar, xstart, ystart, XSIZE=xsize, YSIZE=ysize, /Normal

ENDIF ELSE BEGIN

   bar = CONGRID(bar, CEIL(xsize*!D.X_VSize), CEIL(ysize*!D.Y_VSize), /INTERP)

        ; Decomposed color off if device supports it.

   CASE  StrUpCase(!D.NAME) OF
        'X': BEGIN
            IF thisRelease GE 5.2 THEN Device, Get_Decomposed=thisDecomposed
            Device, Decomposed=0
            ENDCASE
        'WIN': BEGIN
            IF thisRelease GE 5.2 THEN Device, Get_Decomposed=thisDecomposed
            Device, Decomposed=0
            ENDCASE
        'MAC': BEGIN
            IF thisRelease GE 5.2 THEN Device, Get_Decomposed=thisDecomposed
            Device, Decomposed=0
            ENDCASE
        ELSE:
   ENDCASE

   TV, bar, xstart, ystart, /Normal

      ; Restore Decomposed state if necessary.

   CASE StrUpCase(!D.NAME) OF
      'X': BEGIN
         IF thisRelease GE 5.2 THEN Device, Decomposed=thisDecomposed
         ENDCASE
      'WIN': BEGIN
         IF thisRelease GE 5.2 THEN Device, Decomposed=thisDecomposed
         ENDCASE
      'MAC': BEGIN
         IF thisRelease GE 5.2 THEN Device, Decomposed=thisDecomposed
         ENDCASE
      ELSE:
   ENDCASE

ENDELSE

   ; Annotate the color bar.

IF KEYWORD_SET(vertical) THEN BEGIN

   IF KEYWORD_SET(right) THEN BEGIN

      PLOT, [minrange,maxrange], [minrange,maxrange], /NODATA, XTICKS=1, $
         YTICKS=divisions, XSTYLE=1, YSTYLE=9, $
         POSITION=position, COLOR=color, CHARSIZE=charsize, /NOERASE, $
         YTICKFORMAT='(A1)', XTICKFORMAT='(A1)', YTICKLEN=ticklen , $
         YRANGE=[minrange, maxrange], FONT=font, _EXTRA=extra, YMINOR=minor

      AXIS, YAXIS=1, YRANGE=[minrange, maxrange], YTICKFORMAT=format, YTICKS=divisions, $
         YTICKLEN=ticklen, YSTYLE=1, COLOR=color, CHARSIZE=charsize, $
         FONT=font, YTITLE=title, _EXTRA=extra, YMINOR=minor, YTICKNAME=ticknames

   ENDIF ELSE BEGIN

      PLOT, [minrange,maxrange], [minrange,maxrange], /NODATA, XTICKS=1, $
         YTICKS=divisions, XSTYLE=1, YSTYLE=9, YMINOR=minor, $
         POSITION=position, COLOR=color, CHARSIZE=charsize, /NOERASE, $
         YTICKFORMAT=format, XTICKFORMAT='(A1)', YTICKLEN=ticklen , $
         YRANGE=[minrange, maxrange], FONT=font, YTITLE=title, _EXTRA=extra, $
         YTICKNAME=ticknames

      AXIS, YAXIS=1, YRANGE=[minrange, maxrange], YTICKFORMAT='(A1)', YTICKS=divisions, $
         YTICKLEN=ticklen, YSTYLE=1, COLOR=color, CHARSIZE=charsize, $
         FONT=font, _EXTRA=extra, YMINOR=minor

   ENDELSE

ENDIF ELSE BEGIN

   IF KEYWORD_SET(top) THEN BEGIN

      PLOT, [minrange,maxrange], [minrange,maxrange], /NODATA, XTICKS=divisions, $
         YTICKS=1, XSTYLE=9, YSTYLE=1, $
         POSITION=position, COLOR=color, CHARSIZE=charsize, /NOERASE, $
         YTICKFORMAT='(A1)', XTICKFORMAT='(A1)', XTICKLEN=ticklen, $
         XRANGE=[minrange, maxrange], FONT=font, _EXTRA=extra, XMINOR=minor

      AXIS, XTICKS=divisions, XSTYLE=1, COLOR=color, CHARSIZE=charsize, $
         XTICKFORMAT=format, XTICKLEN=ticklen, XRANGE=[minrange, maxrange], XAXIS=1, $
         FONT=font, XTITLE=title, _EXTRA=extra, XCHARSIZE=charsize, XMINOR=minor, $
         XTICKNAME=ticknames

   ENDIF ELSE BEGIN

      PLOT, [minrange,maxrange], [minrange,maxrange], /NODATA, XTICKS=divisions, $
         YTICKS=1, XSTYLE=1, YSTYLE=1, TITLE=title, $
         POSITION=position, COLOR=color, CHARSIZE=charsize, /NOERASE, $
         YTICKFORMAT='(A1)', XTICKFORMAT=format, XTICKLEN=ticklen, $
         XRANGE=[minrange, maxrange], FONT=font, XMinor=minor, _EXTRA=extra, $
         XTICKNAME=ticknames

    ENDELSE

ENDELSE

   ; Restore the previous plot and map system variables.

!P = bang_p
!X = bang_x
!Y = bang_y
!Z = bang_z
!Map = bang_map

END


PRO LOADCOLORS, BOTTOM=BOTTOM, NAMES=NAMES

;- Check arguments
if (n_elements(bottom) eq 0) then bottom = 0

;- Load McIDAS graphics colors
red = [  0, 255,   0, 255,   0, 255,   0, 255, $
         0, 255, 255, 112, 219, 127,   0, 255, $
        90,  50, 150, 255]
grn = [  0,   0, 255, 255, 255,   0,   0, 255, $
         0, 187, 127, 219, 112, 127, 163, 171, $
        90,  50, 50, 90]
blu = [  0, 255, 255,   0,   0,   0, 255, 255, $
       115,   0, 127, 147, 219, 127, 255, 127, $
        90,  50, 255, 200]
tvlct, red, grn, blu, bottom

;- Set color names
names = [ 'Black', 'Magenta', 'Cyan', 'Yellow', 'Green', 'Red', 'Blue', 'White', $
          'Navy', 'Gold', 'Pink', 'Aquamarine', 'Orchid', 'Gray', 'Sky', 'Beige', $
          'DarkGray', 'GraphiteGray', 'Purple', 'FlowerPink' ]

END
[전체]
참고 문헌
[논문]
- 없음
[보고서]
- 없음
[URL]
- 없음
문의사항
[기상학/프로그래밍 언어]
- sangho.lee.1990@gmail.com
[해양학/천문학/빅데이터]
- saimang0804@gmail.com
'프로그래밍 언어 > IDL' 카테고리의 다른 글
| [IDL] 아이디엘 지구물리 원격탐사 실습 자료 : JPG 형식인 Skyview RGB 영상을 이용한 이미지 처리 (0) | 2020.03.27 |
|---|---|
| [IDL] 아이디엘 지구물리 원격탐사 실습 자료 : HDF 형식인 Aqua·Terra/MODIS 극궤도 기상 위성 자료를 이용한 에어로졸 광학두께 가시화 (0) | 2020.03.27 |
| [IDL] 아이디엘 HDF 형식인 Terra/MODIS 극궤도 기상 위성 자료를 이용한 총 오존량 가시화 (0) | 2020.03.25 |
| [IDL] 아이디엘 대기과학 전공자를 위한 IDL (Interactive Data Language) 소개 (0) | 2020.03.24 |
| [IDL] 아이디엘 이미지 처리 (Image Processing) 교육 연수 (0) | 2020.03.23 |