

정보
-
업무명 : 데이터 분포를 그래프로 확인하는 "ggridges" 패키지 소개
-
작성자 : 박진만
-
작성일 : 2020-02-13
-
설 명 :
-
수정이력 :
내용
[특징]
-
데이터의 분포를 확인하는 ggridges 패키지 소개

[활용 자료]
-
없음
[자료 처리 방안 및 활용 분석 기법]
-
없음
[사용법]
-
소스 코드 예시 참조
[사용 OS]
-
Windows 10
[사용 언어]
-
R v3.6.2
-
R Studio v1.2.5033
소스 코드
[명세]
-
전역 설정
-
최대 10 자리 설정
-
메모리 해제
-
# Set Option
options(digits = 10)
memory.limit(size = 9999999999999)
-
라이브러리 읽기
# Library Load
library(ggridges)
-
임의의 DataFrame 생성
-
임의의 정규분포 형태를 띠는 데이터를 생성
-
###임의의 데이터프레임 생성#####
n <- 500
TestData <- data.frame(Group = sample(paste0("Group", 1:5), n, replace = TRUE),
                       Time = sample(1:5, n, replace = TRUE),
                       height = rnorm(n),
                       Data2 = rnorm(n) + rnorm(n) + rnorm(n))
-
geom_ridgeline 을 그리기 위한 데이터 생성
-
"group_by" 를 이용하여 위 데이터에서 Group 와 Time 변수를 그룹화
-
그룹화된 컬럼을 기반으로 나머지 변수들의 평균 수행 (summerise_all)
-
각 그룹별로 새로운 변수를 만들어 카테고리화 하였음 (mutate)
-
#geom_ridgeline을 위한 데이터 생성
TestRidgeLine <- TestData %>%
  group_by(Group, Time) %>%
  summarise_all(funs(mean)) %>%
  mutate(Yposi = recode(Group,
                        Group1 = 0,
                        Group2 = 0.3,
                        Group3 = 0.5,
                        Group4 = 0.7,
                        Group5 = 0.9))
-
높이를 지정한 영역을 그룹별로 가시화 (geom_ridgeline)
ggplot(TestRidgeLine, aes(x = Time, y = Yposi,
                          height = height, group = Yposi,
                          fill = Group)) +
  geom_ridgeline(show.legend = F, alpha = .5,
                 min_height = min(TestRidgeLine[, 3]))
-
데이터 분포를 그리기 : geom_density_ridges 명령어 사용
-
그림에서 외각선 표시하기 : geom_density_ridges2 명령어 사용
ggplot(TestData, aes(x = height, y = Group, fill = Group)) +
  geom_density_ridges2(scale = 1) + facet_wrap(~Group)
-
칠할 색을 지정 : scale_fill_cyclical 명령어 사용
-
테두리 색을 지정 : scale_color_cyclical 명령어 사용
# 칠할 색을 지정 : scale_fill_cyclical 명령어 사용
# 테두리를 지정 : scale_color_cyclical 명령어 사용
ggplot(TestData, aes(x = height, y = Group, fill = Group, color = Group)) +
  geom_density_ridges2(scale = 1, size = 1.5) + facet_wrap(~Group) +
  scale_fill_cyclical(values = c("blue", "green", "yellow")) +
  scale_color_cyclical(values = c("red", "black"))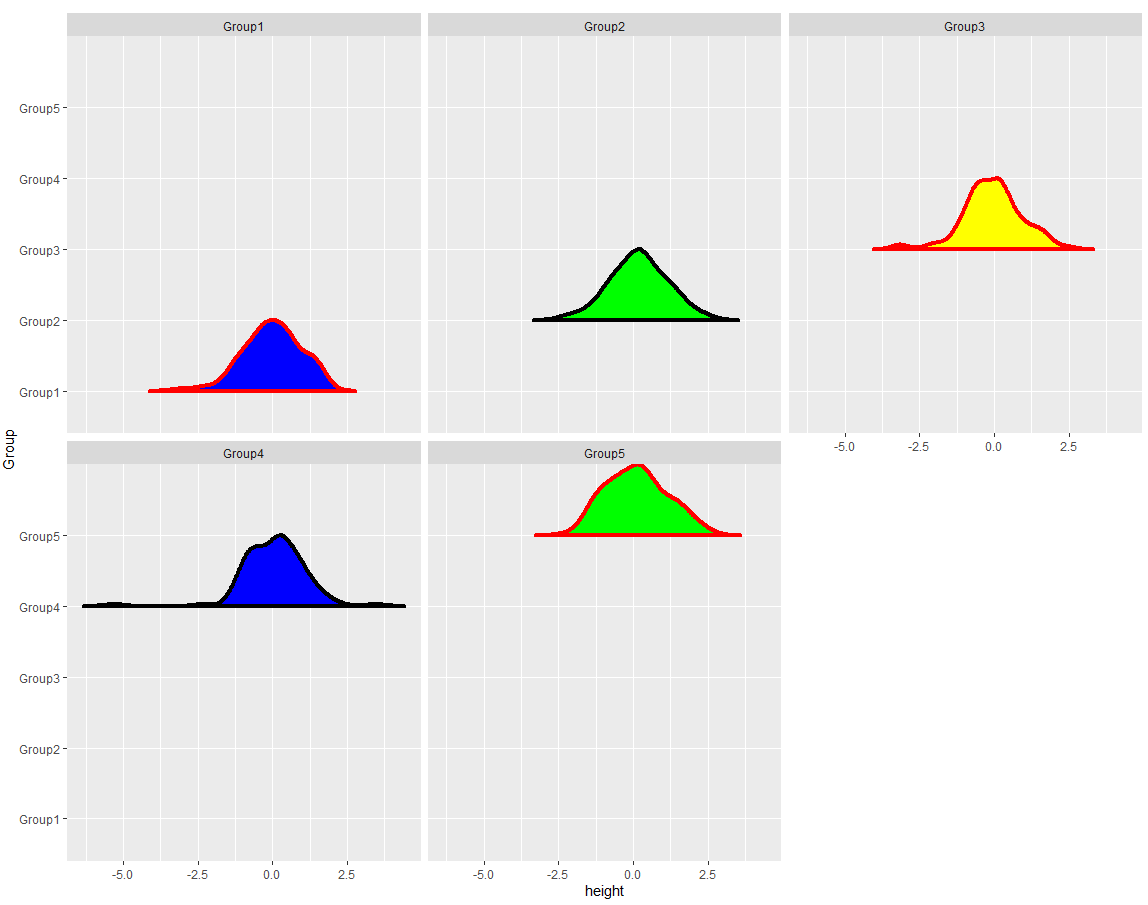
[전체]
# 패키지 설치
install.packages("ggridges")


# 패키지로드 : library 로드 명령
library(ggridges)
library(dplyr)
library(ggplot2)

###임의의 데이터프레임 생성#####
n <- 500
TestData <- data.frame(Group = sample(paste0("Group", 1:5), n, replace = TRUE),
                       Time = sample(1:5, n, replace = TRUE),
                       height = rnorm(n),
                       Data2 = rnorm(n) + rnorm(n) + rnorm(n))


#geom_ridgeline을 위한 데이터 생성
TestRidgeLine <- TestData %>%
  group_by(Group, Time) %>%
  summarise_all(funs(mean)) %>%
  mutate(Yposi = recode(Group,
                        Group1 = 0,
                        Group2 = 0.3,
                        Group3 = 0.5,
                        Group4 = 0.7,
                        Group5 = 0.9))


#높이를 지정한 영역 플롯을 작성 : geom_ridgeline 명령
# 0 이하의 높이 표시 범위를 지정 : min_height 옵션
ggplot(TestRidgeLine, aes(x = Time, y = Yposi,
                          height = height, group = Yposi,
                          fill = Group)) +
  geom_ridgeline(show.legend = F, alpha = .5,
                 min_height = min(TestRidgeLine[, 3]))


# 데이터 분포를 그리기 : geom_density_ridges 명령어 사용
# 그림에서 외각선 표시하기 : geom_density_ridges2 명령어 사용
ggplot(TestData, aes(x = height, y = Group, fill = Group)) +
  geom_density_ridges2(scale = 1) + facet_wrap(~Group)


# 칠할 색을 지정 : scale_fill_cyclical 명령어 사용
# 테두리를 지정 : scale_color_cyclical 명령어 사용
ggplot(TestData, aes(x = height, y = Group, fill = Group, color = Group)) +
  geom_density_ridges2(scale = 1, size = 1.5) + facet_wrap(~Group) +
  scale_fill_cyclical(values = c("blue", "green", "yellow")) +
  scale_color_cyclical(values = c("red", "black"))
참고 문헌
[논문]
- 없음
[보고서]
- 없음
[URL]
- 없음
문의사항
[기상학/프로그래밍 언어]
- sangho.lee.1990@gmail.com
[해양학/천문학/빅데이터]
- saimang0804@gmail.com
'프로그래밍 언어 > R' 카테고리의 다른 글
| [R] 데이터의 구조를 plot으로 확인할 수 있는 "visdat" 패키지 소개 (0) | 2020.03.03 |
|---|---|
| [R] 라디오존데 (Radiosonde) 관측 자료를 이용한 고도별 온도 (Temperature) 및 상대 습도 (Relative Humidity) 등고선 가시화 (0) | 2020.03.03 |
| [R] 직달 일사계 (CHP1, MS56, DR02, GWNU) 비교 관측 자료를 이용한 감도정수 보정 및 시계열 가시화 (0) | 2020.03.01 |
| [R] 하와이 마우나로아 (Manuna Loa)에서 이산화탄소 (CO2) 농도 자료를 이용한 통계 처리 및 시계열 가시화 (0) | 2020.03.01 |
| [R] nonogram (네모네모로직) 해결 알고리즘 및 가시화 (0) | 2020.02.23 |