

정보
-
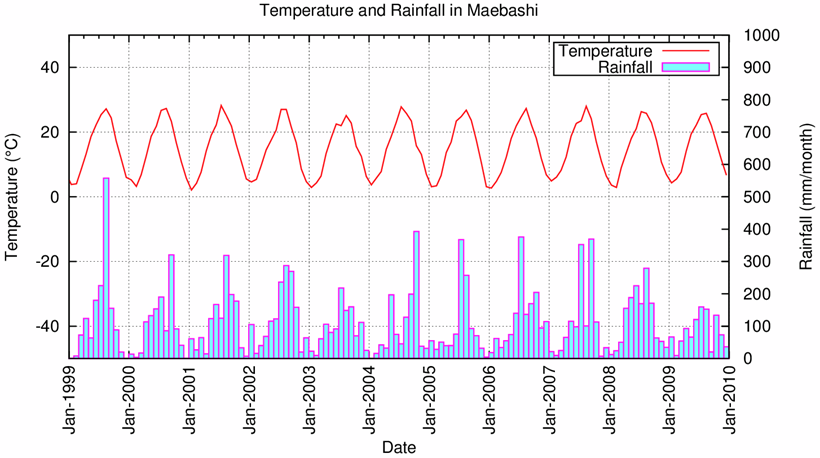
업무명 : 그누플롯 월별 온도와 강수 변동에 따른 가시화
-
작성자 : 이상호
-
작성일 : 2019-09-01
-
설 명 :
-
수정이력 :
내용
[특징]
-
월별 온도와 강우 변동을 효과적으로 이해하기 위해 가시화 도구가 필요하며 이 프로그램은 이러한 목적을 달성하기 위해 고안된 소프트웨어
[기능]
-
두개의 축을 이용한 시계열 가시화
[활용 자료]
-
없음
[자료 처리 방안 및 활용 분석 기법]
-
없음
[사용법]
-
소스 코드를 실행 (gnuplot Visualization_With_Monthly_Temperature_And_Rainfall_Change.gs)
-
가시화 결과를 확인
[사용 OS]
-
Linux
[사용 언어]
-
Gnuplot
소스 코드
[명세]
reset
set terminal postscript eps enhanced color font "Arial" 14
set output "fig_gpl_tsd_TR.eps"
set size ratio 0.5
set title "Temperature and Rainfall in Maebashi"
set datafile separator ","
set xdata time
set timefmt "%Y/%m/%d"
set format x "%b-%Y"
set format y "%.0f"
set xtics offset 0,-4.0 rotate by 90
set ytics
set y2tics
set xlabel "Date" offset 0,-1.5
set ylabel "Temperature ({/Symbol \260}C)"
set y2label "Rainfall (mm/month)"
set grid
set xrange ["1999/01/01":"2009/12/31"]
set yrange [-50:50]
set y2range [0:1000]
set key right top
set key box
set key width -1
set style fill solid 0.5 border rgb "magenta"
plot \
"inp_TR_maebashi.txt" using 1:2 axes x1y1 with lines linetype 1 linewidth 2 linecolor rgb "red" title "Temperature", \
"inp_TR_maebashi.txt" using 1:5 axes x1y2 with boxes linetype 1 linewidth 2 linecolor rgb "cyan" title "Rainfall"
[GitHub Gist]
결과

-
오른쪽 정렬왼쪽 정렬가운데 정렬
-
작게문서 너비옆트임
사진 설명을 입력하세요.
참고 문헌
[논문]
- 없음
[보고서]
- 없음
[URL]
- 없음
문의사항
[기상학/프로그래밍 언어]
- sangho.lee.1990@gmail.com
[해양학/천문학/빅데이터]
- saimang0804@gmail.com
'프로그래밍 언어 > Gnuplot' 카테고리의 다른 글
| [Gnuplot] 온라인/오프라인 리눅스 (Linux) 환경에 따른 그누플롯 (Gnuplot) 설치 방법 (1) | 2020.02.08 |
|---|---|
| [Gnuplot] 그누플롯 일사계 관측 자료를 이용한 환풍 유무에 따른 시계열 (0) | 2019.09.01 |
| [Gnuplot] 그누플롯 기계 도면을 이용한 가시화 (0) | 2019.09.01 |
| [Gnuplot] 그누플롯 RCP26 모델 결과를 이용한 시계열 (0) | 2019.08.31 |
| [Gnuplot] 그누플롯 기초 및 필수 명령어 설정 (0) | 2019.08.31 |