

정보
-
업무명 : 그라즈 NetCDF 형식인 NOAA 월평균 해수면 온도 자료를 이용한 가시화
-
작성자 : 이상호
-
작성일 : 2019-09-07
-
설 명 :
-
수정이력 :
내용
[특징]
-
NetCDF 결과를 이해하기 위해 가시화 도구가 필요하며 이 프로그램은 이러한 목적을 달성하기 위해 고안된 소프트웨어
[기능]
-
NetCDF 형식으로 가시화
[활용 자료]
-
자료 : NOAA Optimum Intepolation를 이용한 월평균 해수면 온도
-
기간 : 1981년 12월 01일
[자료 처리 방안 및 활용 분석 기법]
-
없음
[사용법]
-
GrADS 가시화에 필요한 라이브러리를 동일 디렉터리 위치
-
xcbar.gs (제공처 : http://kodama.fubuki.info/wiki/wiki.cgi/GrADS/script?lang=jp)
-
worldmap (제공처 : ftp://cola.gmu.edu/grads/boundaries/worldmap)
-
소스 코드를 실행
(csh Visualization_Using_NetCDF_Form_of_NOAA_Optimum_Interpolation_SST.csh) -
가시화 결과를 확인
[사용 OS]
-
Linux
[사용 언어]
-
GrADS
-
ShellScript (csh)
소스 코드
[명세]
#!/bin/csh

foreach fn (`seq 0 5`)

cat >! 1.bat << EOF
reinit
xopen sst.mnmean.nc
set display color white
set mpdset worldmap
set lon 0 360
set lat -90 90
set xlint 60
set ylint 30
set font ${fn}
*set xlab %0.0f\`3.\`n
*set ylab %0.0f\`3.\`n
set parea 1 10.5 0.5 8.5
set xlopts 1 6 0.18
set ylopts 1 6 0.18
set t 1
set grid off
set gxout shaded
set grads off

color 0 30 0.2 -kind rainbow
d sst

set gxout contour
set clopts 1 6 0.125
set cint 6
d sst

xcbar 1 10.5 0.4 0.65 -fwidth 0.18 -fheight 0.18 -edge box -fstep 15 -line off

draw title NOAA Optimum Interpolation (OI) SST V2 (December 1st, 1981)\
set string 1 tc
set strsiz 0.18 0.18
draw string 5.5 1.0 Monthly Mean of Sea Surface Temperature [\`3.\`0C]

gxprint 1.png
quit

EOF

grads -blc "exec 1.bat"

mv -f 1.png OUTPUT/${fn}.png
#rm -f 1.bat
#display 1.png

end
[GitHub Gist]
결과
-
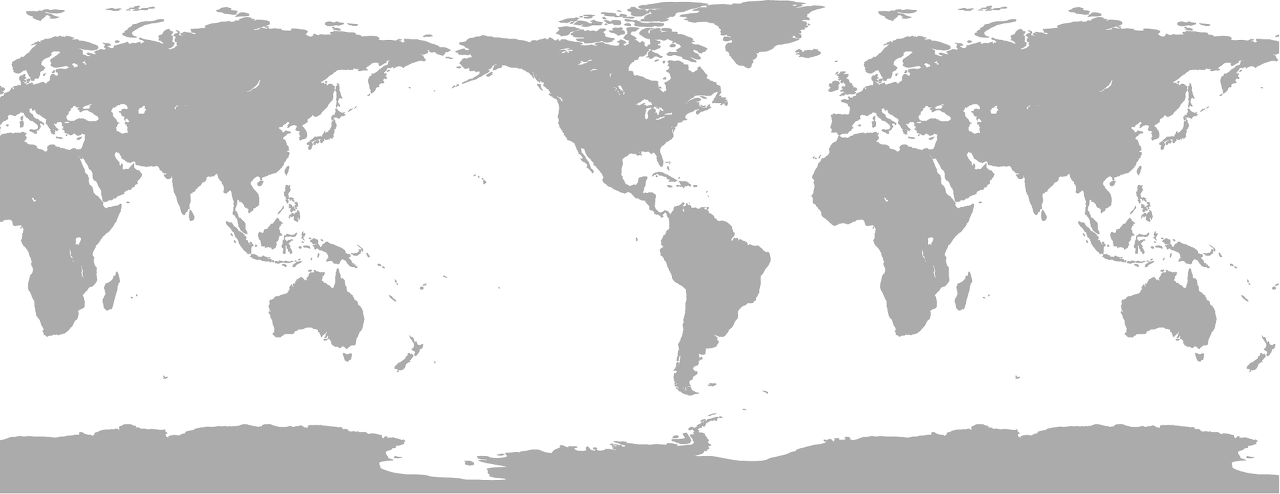
GrADS에 필요한 worldmap 가시화
-
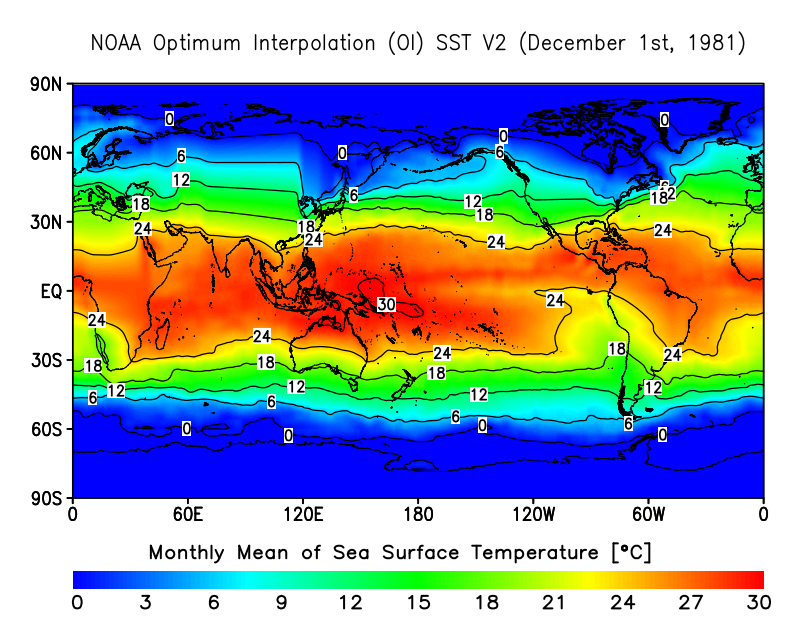
1981년 12월 01일 NOAA OI 월평균 해수면온도 자료를 이용한 가시화
-
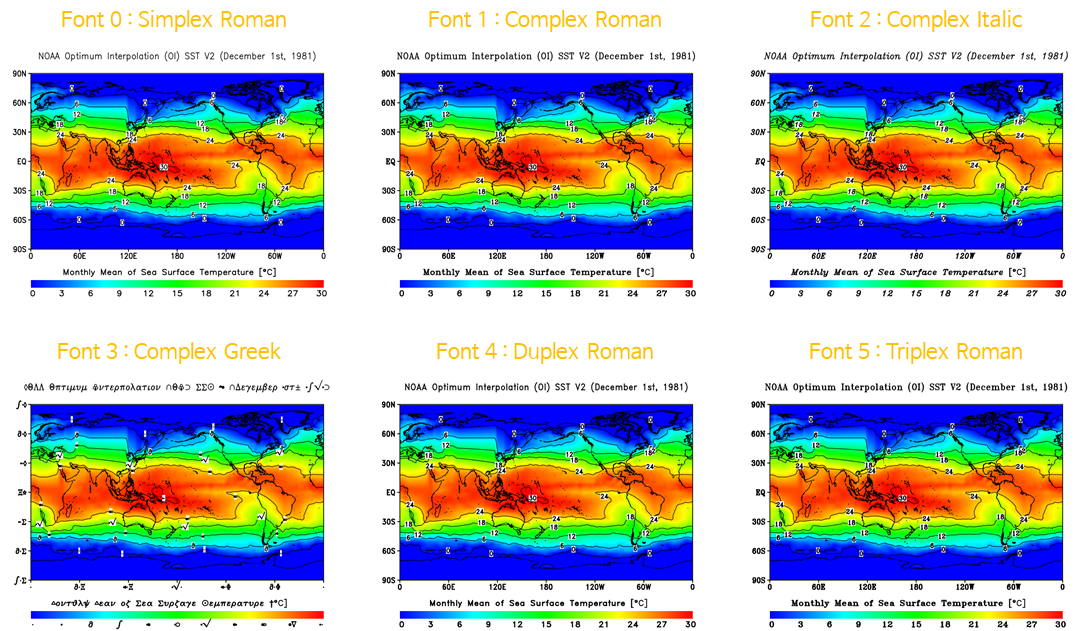
GrADS 글꼴 설정에 따른 가시화
참고문헌
How to install grib2ctl.pl and wgrib in linux
Dear All, Now we are going to see how to install wgrib and grib2ctl in our linux machine. step 1: First of we need to install GRADS From the above link we can get the source. In ubuntu $ sudo apt-g…
tuxcoder.wordpress.com
문의사항
[기상학/프로그래밍 언어]
- sangho.lee.1990@gmail.com
[해양학/천문학/빅데이터]
- saimang0804@gmail.com
'프로그래밍 언어 > GrADS' 카테고리의 다른 글
| [GrADS] 그라즈 컬러 테이블 및 팔레트 소개 (0) | 2020.04.07 |
|---|---|
| [GrADS, ShellScript] 그라즈 HDF 형식인 Terra/MODIS 및 Aqua/MODIS 자료를 이용한 에어로졸 광학두께 가시화 (0) | 2019.09.22 |
| [GrADS, ShellScript] 그라즈 Grib 형식인 ECMWF 모델 결과를 이용한 가시화 (0) | 2019.09.07 |
| [GrADS, ShellScript] 그라즈 아스키 (ASCII) 형식인 복사전달모델 (RTM) 결과를 이용한 가시화 (0) | 2019.09.03 |
| [GrADS, ShellScript] 그라즈 중규모 기상모델 (WRF ARW)을 이용한 가시화 (0) | 2019.09.02 |