

정보
- 업무명 : 텍스트 (TXT) 형식인 날짜별 기온 자료를 이용한 시각화 및 자동화 수행
- 작성자 : 이상호
- 작성일 : 2021-01-02
- 설 명 :
- 수정이력 :
내용
[개요]
- 안녕하세요? 기상 연구 및 웹 개발을 담당하고 있는 해솔입니다.
- NCL (NCAR Command Language)은 미국의 NCAR (National Center for Atmospheric Research)에서 개발된 언어로서 지구과학/대기과학 분야에서 특화되었습니다. 이는 다양한 분야에서 널리 사용되는 Matlab과 비교할 때 라이브러리를 통해 쉽게 계산할 수 있습니다.
- 특히 예전에 자주 사용되는 소프트웨어인 GrADS는 간단한 인터페이스로 초보자도 빨리 익힐 수 있으나 소프트웨어의 유연성이 떨어집니다.
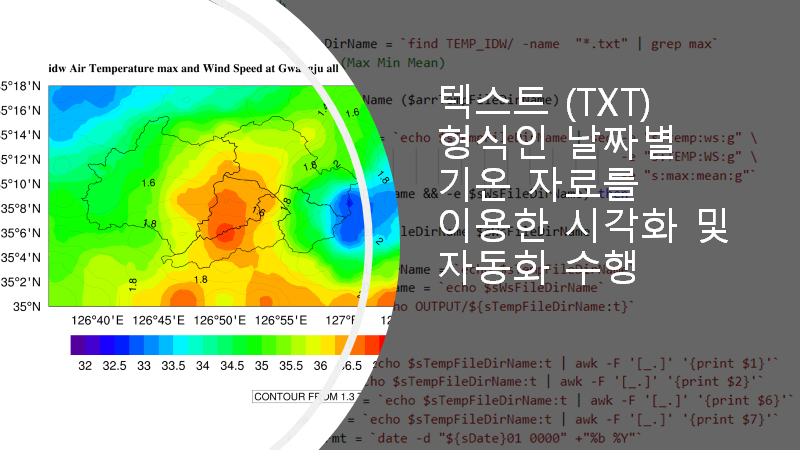
- 오늘 포스팅에서는 텍스트 (TXT) 형식인 날짜별 기온 자료를 이용한 시각화 및 자동화 수행을 소개합니다.
- 추가로 온라인/오프라인 리눅스 환경에 따른 NCL 설치 방법을 소개한 링크를 보내드립니다.
[NCL] 온라인/오프라인 리눅스 (Linux) 환경에 따른 NCL 설치 방법
정보 업무명 : 온라인/오프라인 리눅스 (Linux) 환경에 따른 NCL 설치 방법 작성자 : 이상호 작성일 : 2020-01-15 설 명 : 수정이력 : 내용 [개요] 안녕하세요? 웹 개발 및 연구 개발을 담당하고
shlee1990.tistory.com
[특징]
- NCL을 통해 시각화하기 위해서 자료 처리 기술이 요구되며 이 프로그램은 이러한 목적을 달성하기 위한 소프트웨어
[기능]
- 텍스트 파일을 이용하여 컬러바 부여
- 각 위/경도에 따른 시각화
- 자동화 수행
[활용 자료]
- 자료명 : max_temp
- 자료 종류 : 연평균 최고 기온
- 확장자 : txt
- 영역 : 대한민국 광주
- 기간 : 2016년 07-09월
idw_max_temp_temp_summary_all_201007.txt
0.06MB

- 자료명 : gwj_gu.shp
- 자료 종류 : 광주 지도 경계선
- 확장지 : shp

[자료 처리 방안 및 활용 분석 기법]
- 없음
[사용법]
- 소스 코드 참조
[사용 OS]
- Linux (CentOS v7.3)
- VMware Workstation Pro v15.5
[사용 언어]
- NCL v6.6.2
- ShellScript (csh)
소스 코드
- 소스 코드는 단계별로 수행하며 상세 설명은 다음과 같습니다.
- 작업 환경의 경우 수행 쉘, 소스 코드, 지도 정보, 입력 자료, 출력 자료로 구성되어 있습니다.
| 디렉터리명 | 파일명 | |
| 작업 경로 | prjDir=/SYSTEM/JinMan-Park | |
| 수행 쉘 | ${prjDir} | RunShell-VisualizationUsingNcl.csh |
| 소스 코드 | ${prjDir} | Template_Visualization_Using_Text_Format_v4_2019.ncl |
| 지도 정보 | ${prjDir}/INPUT/MAP | 001_gwj_gu.shp |
| 입력 자료 | ${prjDir}/TEMP_IDW | idw_max_ws_ws_summary_all_[%Y, %Y%m, %Y%m%d].txt |
| 출력 자료 | ${prjDir}/OUTPUT | idw_max_temp_temp_summary_all_[%Y, %Y%m, %Y%m%d].txt.png |

[명세]
- [1 단계] 수행 쉘 실행
- find 명령어를 통해 TEMP_IDW 경로의 파일 목록 조회
- 파일 목록에 대한 반복문 수행
- [2 단계] 파일 존재 여부 확인 및 사용자 설정
- if (-e) 명령어를 통해 파일 존재를 확인
- 시각화에 필요한 정보 (sPngName, sPngTitle 등)를 설정한다.
- [3 단계] 사용자 설정 및 NCL 실행
- 템플릿 소스 코드에서 사용자 정보를 입력하여 소스 코드 (Visualization_Using_Text_Format_v4_2019.ncl)를 저장한 후 실행합니다.
- 출력 자료 경로에서 이미지를 확인합니다.
#!/bin/csh

set arrTempFileDirName = `find TEMP_IDW/ -name  "*.txt" | grep max`
# set sColName = (Max Min Mean)

foreach sTempFileDirName ($arrTempFileDirName)

   set sWsFileDirName = `echo $sTempFileDirName | sed -e "s:temp:ws:g" \
                                                      -e "s:TEMP:WS:g" \
                                                      -e "s:max:mean:g"`
   if (-e $sTempFileDirName && -e $sWsFileDirName) then

      echo "[S]" $sTempFileDirName $sWsFileDirName

      set sTmpTempFileDirName = `echo $sTempFileDirName`
      set sTmpWsFileDirName = `echo $sWsFileDirName`
      set sPngName = `echo OUTPUT/${sTempFileDirName:t}`

      # set Png Title
      set sMethod = `echo $sTempFileDirName:t | awk -F '[_.]' '{print $1}'`
      set sType = `echo $sTempFileDirName:t | awk -F '[_.]' '{print $2}'`
      set sPeriod   = `echo $sTempFileDirName:t | awk -F '[_.]' '{print $6}'`
      set sDate   = `echo $sTempFileDirName:t | awk -F '[_.]' '{print $7}'`
      set sDateFmt = `date -d "${sDate}01 0000" +"%b %Y"`

      set sPngTitle = `echo "${sDateFmt} ${sMethod} Air Temperature ${sType} and Wind Speed at Gwangju ${sPeriod}"`

      cat Template_Visualization_Using_Text_Format_v4_2019.ncl | \
         sed -e "s:%sTempFileDirName:${sTmpTempFileDirName}:g" \
             -e "s:%sWsFileDirName:${sTmpWsFileDirName}:g" \
             -e "s:%sPngName:${sPngName}:g" \
             -e "s:%sPngTitle:${sPngTitle}:g" \
             -e "s:%iColNumber:2:g" > Visualization_Using_Text_Format_v4_2019.ncl

      ncl Visualization_Using_Text_Format_v4_2019.ncl

   else
      echo "[F]" $sTempFileDirName $sWsFileDirName
   endif

end

[전체]
- RunShell-VisualizationUsingNcl.csh
#!/bin/csh

set arrTempFileDirName = `find TEMP_IDW/ -name  "*.txt" | grep max`
# set sColName = (Max Min Mean)

foreach sTempFileDirName ($arrTempFileDirName)

   set sWsFileDirName = `echo $sTempFileDirName | sed -e "s:temp:ws:g" \
                                                      -e "s:TEMP:WS:g" \
                                                      -e "s:max:mean:g"`
   if (-e $sTempFileDirName && -e $sWsFileDirName) then

      echo "[S]" $sTempFileDirName $sWsFileDirName

      set sTmpTempFileDirName = `echo $sTempFileDirName`
      set sTmpWsFileDirName = `echo $sWsFileDirName`
      set sPngName = `echo OUTPUT/${sTempFileDirName:t}`

      # set Png Title
      set sMethod = `echo $sTempFileDirName:t | awk -F '[_.]' '{print $1}'`
      set sType = `echo $sTempFileDirName:t | awk -F '[_.]' '{print $2}'`
      set sPeriod   = `echo $sTempFileDirName:t | awk -F '[_.]' '{print $6}'`
      set sDate   = `echo $sTempFileDirName:t | awk -F '[_.]' '{print $7}'`
      set sDateFmt = `date -d "${sDate}01 0000" +"%b %Y"`

      set sPngTitle = `echo "${sDateFmt} ${sMethod} Air Temperature ${sType} and Wind Speed at Gwangju ${sPeriod}"`

      cat Template_Visualization_Using_Text_Format_v4_2019.ncl | \
         sed -e "s:%sTempFileDirName:${sTmpTempFileDirName}:g" \
             -e "s:%sWsFileDirName:${sTmpWsFileDirName}:g" \
             -e "s:%sPngName:${sPngName}:g" \
             -e "s:%sPngTitle:${sPngTitle}:g" \
             -e "s:%iColNumber:2:g" > Visualization_Using_Text_Format_v4_2019.ncl

      ncl Visualization_Using_Text_Format_v4_2019.ncl

#      exit
   else
      echo "[F]" $sTempFileDirName $sWsFileDirName
   endif

end
- Template_Visualization_Using_Text_Format_v4_2019.ncl
begin

   ;=============================================
   ;  File Name
   ;=============================================
   dfData_t = asciiread("%sTempFileDirName",(/1891, 3/), "float")
   dfData_ws = asciiread("%sWsFileDirName",(/1891, 3/), "float")
   sPngName = "%sPngName" ; mean

   ; sShpName = "INPUT/MAP/gadm36_KOR_2.shp"
   sShpName2 = "INPUT/MAP/001_gwj_gu.shp"

   ;=============================================
   ;  Set Value
   ;=============================================
   nLon  = dfData_t( : , 0)
   nLat  = dfData_t( : , 1)

   ; mean value
   nVal  = dfData_t( : , %iColNumber) - 273.15
   nVal2 = dfData_ws( : , %iColNumber)

   ;============================================
   ;  Option (res)
   ;=============================================
   wks = gsn_open_wks("png", "%sPngName")
   res = True
   res@gsnDraw               =  False                 ;-- don't draw the plot yet
   res@gsnFrame              =  False                 ;-- don't advance the frame
   res@txFont   = "helvetica"
   res@cnFillPalette          = "rainbow"                ;-- choose colormap
   res@gsnMaximize            =  True
   res@pmTickMarkDisplayMode  = "Always"    ; tick mark (위,경도) 표시
   ; res@cnLevelSelectionMode = "ExplicitLevels"   ; set explicit contour levels
   ; res@cnLevels    = (/0, 30, 60, 90/)   ; set levels
   res@cnLevelSelectionMode   = "ManualLevels"     ; set manual contour levels

   ; Max
   ;res@cnMinLevelValF         =  26           ;-- contour min. value
   ;res@cnMaxLevelValF         =  31           ;-- contour max. value
   res@cnMinLevelValF         =  tointeger(min(nVal))           ;-- contour min. value
   res@cnMaxLevelValF         =  tointeger(min(nVal)) + 5           ;-- contour max. value

   ; Min
   ; res@cnMinLevelValF         =  290           ;-- contour min. value
   ; res@cnMaxLevelValF         =  310           ;-- contour max. value

     res@cnLevelSpacingF        =  0.25           ;-- contour interval(200)
   ;   res@lbLabelStride          =  3            ;-- label every 5th values on labelbar
   res@cnLinesOn = False;
   res@mpOutlineOn = False;
   res@mpLandFillColor = "white"
   res@lbBoxLinesOn = False


   res@mpMaxLatF = 35.3
   res@mpMinLatF = 35.0

   res@mpMaxLonF = 127.1
   res@mpMinLonF = 126.6


   res@cnFillOn               = True               ; color fill
   res@cnLinesOn              = False             ; no contour lines
   res@cnLineLabelsOn         = False             ; no contour labels
   res@cnFillMode             = "AreaFill"     ;-- use CellFill method

   res@tiMainFontHeightF      =  0.015            ;-- title font size
   res@tiMainFont             = "times-bold"
   res@gsnStringFontHeightF = 0.018              ; sub title size
   res@tmXBLabelFontHeightF = 0.017              ; xlab, ylab size
   res@lbLabelFontHeightF   = 0.017              ; colorbar font size
   res@tmXTMajorLengthF = 0                      ; tick length
   res@trGridType = "TriangularMesh"

   res@sfXArray = nLon
   res@sfYArray = nLat

   shpres                    =  True
   shpres@gsLineThicknessF   =  2.0                   ;-- increase line thickness
   shpres@gsLineColor        = "black"             ;-- line color


   ;  Option (res2)
   ;=============================================
   res2 = True
   res2@gsnDraw               =  False                 ;-- don't draw the plot yet
   res2@gsnFrame              =  False                 ;-- don't advance the frame
   res2@txFont   = "helvetica"
   res2@cnFillPalette          = "rainbow"                ;-- choose colormap
   res2@gsnMaximize            =  True
   res2@pmTickMarkDisplayMode  = "Always"    ; tick mark (위,경도) 표시
   res@cnLevelSelectionMode   = "ManualLevels"     ; set manual contour levels

   ; Max
   res2@cnMinLevelValF         =  0           ;-- contour min. value
   res2@cnMaxLevelValF         =  5          ;-- contour max. value


   res2@lbLabelStride          =  3            ;-- label every 5th values on labelbar
   ;res2@mpOutlineOn = True;
   ;res2@mpLandFillColor = "white"
   res2@lbBoxLinesOn = True


   res2@cnFillOn               = False               ; color fill
   res2@cnLinesOn              = True             ; contour lines
   ;res2@cnLevelSpacingF        = 1
   res2@cnLevelSpacingF        = 0.1
   res2@cnSmoothingOn          = True
   res2@cnLineLabelsOn         = True             ; contour labels
   res2@cnLineColor            = "dimaray"
   ;res2@cnLevels               = 1
   res2@cnLevels               = 0.1
   ;res2@cnLineThicknessF       = 2
   res2@cnLineThicknessF       = 0.1
   res2@cnLineLabelBackgroundColor = -1

   res2@cnFillMode             = "AreaFill"     ;-- use CellFill method

   res2@tiMainFontHeightF      =  0.02            ;-- title font size
   res2@tiMainFont             = "times-bold"
   res2@gsnStringFontHeightF = 0.018              ; sub title size
   res2@tmXBLabelFontHeightF = 0.017              ; xlab, ylab size
   res2@lbLabelFontHeightF   = 0.017              ; colorbar font size
   res2@tmXTMajorLengthF = 0                      ; tick length
   res2@trGridType = "TriangularMesh"

   res2@sfXArray = nLon
   res2@sfYArray = nLat

   shpres                    =  True
   shpres@gsLineThicknessF   =  2.0                   ;-- increase line thickness
   shpres@gsLineColor        = "black"             ;-- line color


   ;============================================
   ;  Title Options
   ;============================================
   res@tiMainString         =  "%sPngTitle"
   res@tiMainJust            =  "CenterLeft"
   res@tiMainPosition        =  "Left"


   ;=============================================
   ;  Plot
   ;=============================================
   ;plot = gsn_csm_contour_map(wks, nVal,nVal2, res,res2)
   plot = gsn_csm_contour_map(wks, nVal, res)
   plot2 = gsn_csm_contour(wks, nVal2, res2)
   dumstr        = unique_string("poly")

   plot@$dumstr$ = gsn_add_shapefile_polylines(wks, plot, sShpName2, shpres)
   ;plot2@$dumstr$ = gsn_add_shapefile_polylines(wks, plot2, sShpName2, shpres)

   overlay(plot,plot2)

   draw(plot)
   frame(wks)

end
참고 문헌
[논문]
- 없음
[보고서]
- 없음
[URL]
- 없음
문의사항
[기상학/프로그래밍 언어]
- sangho.lee.1990@gmail.com
[해양학/천문학/빅데이터]
- saimang0804@gmail.com
'프로그래밍 언어 > NCL' 카테고리의 다른 글
| [NCL] 쉘 스크립트 (Shell Script)에서 명령 줄 입력 파라메타 설정 및 NCL 실행 (0) | 2020.12.03 |
|---|---|
| [NCL] 텍스트 (TXT) 형식인 기온 자료를 이용한 시각화 (0) | 2020.12.03 |
| [NCL] 전지구 기온 자료를 이용한 가시화 : 기본 구조 및 세부 내용 (0) | 2020.02.28 |
| [NCL] NetCDF 형식 및 NCL 변수 구조 (0) | 2020.02.27 |
| [NCL] 대화식 및 스크립트 모드 소개 (0) | 2020.01.21 |