정보
-
업무명 : 데이터 분석에서 자주 사용하는 "tidyverse" 패키지 소개
-
작성자 : 이상호
-
작성일 : 2020-02-13
-
설 명 :
-
수정이력 :
내용
[특징]
-
데이터 분석을 위해서 tidyverse 패키지가 요구되며 이 프로그램은 이러한 목적을 달성하기 위한 소프트웨어
[기능]
-
tidyverse 패키지 소개
[활용 자료]
-
없음
[자료 처리 방안 및 활용 분석 기법]
-
없음
[사용법]
-
소스 코드 예시 참조
[사용 OS]
-
Windows10
[사용 언어]
-
R v3.6.2
-
R Studio v1.2.5033
소스 코드
[명세]
-
전역 설정
-
최대 10 자리 설정
-
메모리 해제
-
# Set Option
options(digits = 10)
memory.limit(size = 9999999999999)
-
라이브러리 읽기
# Library Load
library(tidyverse)
-
Data Frame 설정
-
기본 데이터 iris를 이용하여 테스트 자료 생성
-
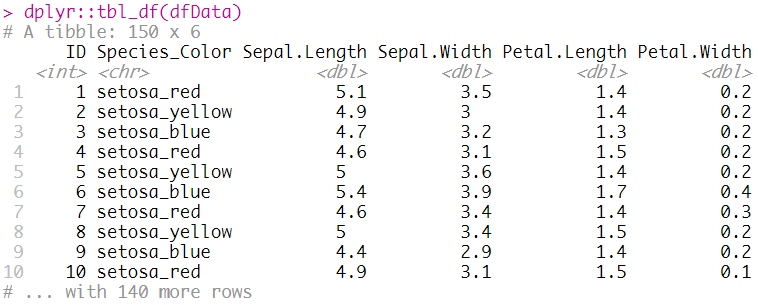
# Set Data Frame
dfData = as.tibble(iris) %>%
    rowid_to_column(var = "ID") %>%
    mutate(
        Species = str_c(
            Species
            , c("red", "yellow", "blue")
            , sep = "_")
        ) %>%
    rename("Species_Color" = Species) %>%
    select(ID, Species_Color, everything())
-
Data Frame를 이용한 L1 전처리
-
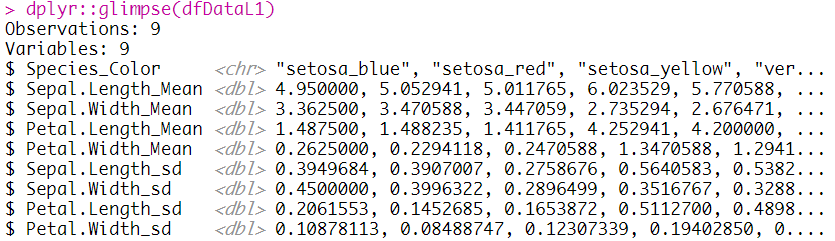
"Species_Color"에 따라 통계 (평균, 표준편차) 계산
-
# L1 Processing Using Data Frame
dfDataL1 = dfData %>%
    select(-ID) %>%
    group_by(Species_Color) %>%
    summarise_all(
        list(
            "Mean" = ~ mean(., na.rm = TRUE)
            , "sd" = ~ sd(., na.rm = TRUE)
            )
        ) %>%
    ungroup()
-
Data Frame를 이용한 L2 전처리
-
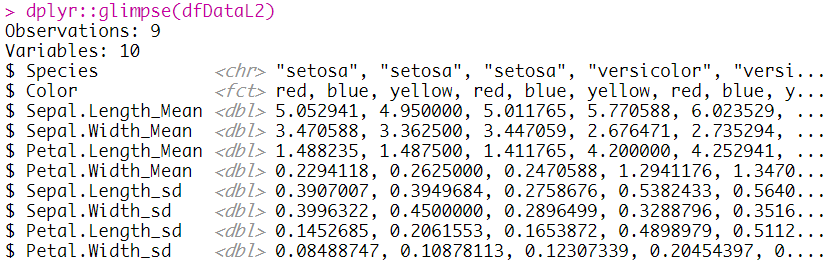
"Species_Color" 변수를 "Species" 및 "Color"로 분할
-
"Color"의 경우 red, blue, yellow를 가지는 Factor 변환
-
"Species" 및 "Color"에 따른 통계 (평균, 표준편차) 계산
-
# L2 Processing Using Data Frame
dfDataL2 = dfData %>%
    select(-ID) %>%
    separate(Species_Color, into = c("Species", "Color"), sep = "_") %>%
    mutate(Color = factor(Color, c("red", "blue", "yellow"))) %>%
    group_by(Species, Color) %>%
    summarise_all(
        list(
            "Mean" = ~ mean(., na.rm = TRUE)
            , "sd" = ~ sd(., na.rm = TRUE))
        ) %>%
    ungroup()
-
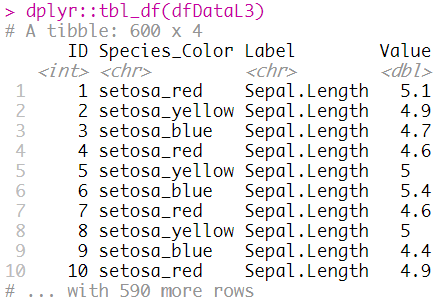
Data Frame를 이용한 L3 전처리
-
"ID" 및 "Species_Color"에 대해 세로형 변환
-
# L3 Processing Using Data Frame
dfDataL3 = dfData %>%
    gather(key = "Label", value = "Value", -ID, -Species_Color)
-
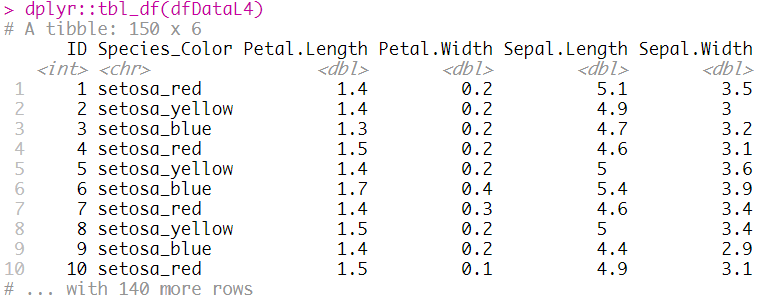
L3를 이용한 L4 전처리
-
"ID"와 "Species_Color" 및 "Label"에 대해 가로형 변환
-
즉 초기 "dfData"와 동일
-
# L4 Processing Using Data Frame
dfDataL4 = dfDataL3 %>%
    spread(key = Label, value = Value)
[전체]
# Set Option
options(digits = 10)
memory.limit(size = 9999999999999)

# Library Load
library(tidyverse)

# Set Data Frame
dfData = as.tibble(iris) %>%
    rowid_to_column(var = "ID") %>%
    mutate(
        Species = str_c(
            Species
            , c("red", "yellow", "blue")
            , sep = "_")
        ) %>%
    rename("Species_Color" = Species) %>%
    select(ID, Species_Color, everything())

dplyr::tbl_df(dfData)

# L1 Processing Using Data Frame
dfDataL1 = dfData %>%
    select(-ID) %>%
    group_by(Species_Color) %>%
    summarise_all(
        list(
            "Mean" = ~ mean(., na.rm = TRUE)
            , "sd" = ~ sd(., na.rm = TRUE)
            )
        ) %>%
    ungroup()

dplyr::glimpse(dfDataL1)

# L2 Processing Using Data Frame
dfDataL2 = dfData %>%
    select(-ID) %>%
    separate(Species_Color, into = c("Species", "Color"), sep = "_") %>%
    mutate(Color = factor(Color, c("red", "blue", "yellow"))) %>%
    group_by(Species, Color) %>%
    summarise_all(
        list(
            "Mean" = ~ mean(., na.rm = TRUE)
            , "sd" = ~ sd(., na.rm = TRUE))
        ) %>%
    ungroup()

dplyr::glimpse(dfDataL2)

# L3 Processing Using Data Frame
dfDataL3 = dfData %>%
    gather(key = "Label", value = "Value", -ID, -Species_Color)

dplyr::tbl_df(dfDataL3)

# L4 Processing Using Data Frame
dfDataL4 = dfDataL3 %>%
    spread(key = Label, value = Value)

dplyr::tbl_df(dfDataL4)
참고 문헌
[논문]
- 없음
[보고서]
- 없음
[URL]
- 없음
문의사항
[기상학/프로그래밍 언어]
- sangho.lee.1990@gmail.com
[해양학/천문학/빅데이터]
- saimang0804@gmail.com
'프로그래밍 언어 > R' 카테고리의 다른 글
| [R] nonogram (네모네모로직) 해결 알고리즘 및 가시화 (0) | 2020.02.23 |
|---|---|
| [R] 파일 관련 기본 명령어 (디렉터리/파일 선택, 생성, 삭제, 복사) 소개 (0) | 2020.02.13 |
| [R] 파일 읽는 GUI를 제공하는 "ezpickr" 패키지 소개 (2) | 2020.02.12 |
| [R] 대화형 테이블을 생성하는 "DT" 패키지 소개 (0) | 2020.02.12 |
| [R] ggplot2에서 텍스트 추가를 위한 "ggfittext" 패키지 소개 (0) | 2020.02.12 |


최근댓글