정보
업무명 : 대화형 테이블 생성하는 "DT" 패키지 소개
작성자 : 박진만
작성일 : 2020-02-11
설 명 :
수정이력 :
내용
[특징]
대화형 테이블 생성하고 조작하는 "DT" 패키지 소개
[기능]
DataTables 는 대화 형 테이블을 만들어주는 JavaScript 라이브러리를 R로 사용할 수 있도록 패키지
{htmlwidgets}를 이용함
R의 matrix와 dataframe에서 HTML 형식의 테이블을 작성
즉석에서 필터링, 정렬등 편리한 기능을 사용할 수 있음
RStudio 에서 실행시 Rmd와의 조합이 좋음
[사용법]
예제 소스코드 실행
[사용 OS]
Windows10
[사용 언어]
R v3.6.2
R Studio v1.2.5033
소스 코드
[Hello DT!]
설치
CRAN 에서 설치
install.packages("DT")패키지 로드
library(DT)
DT 실행
만들어 보자
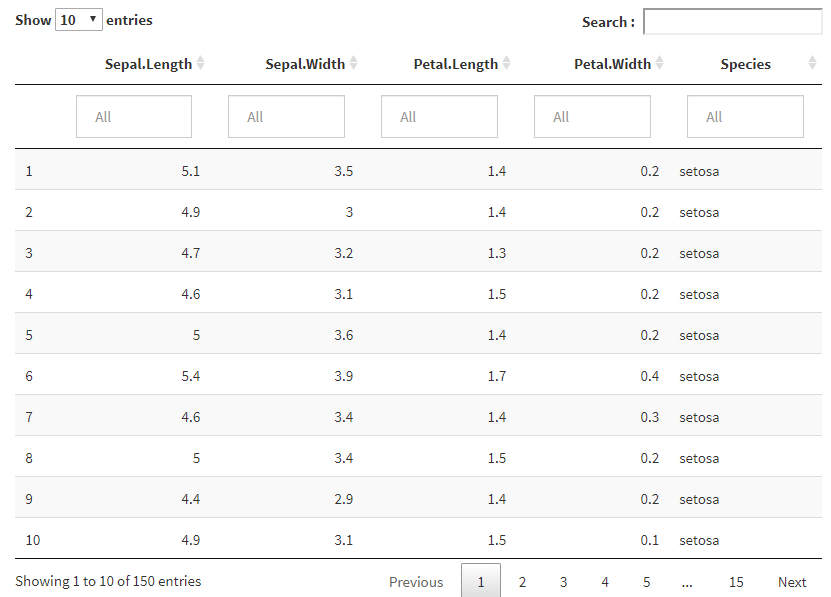
실행하면 하단의 화면이 출력된다.
library(DT)
datatable(iris)
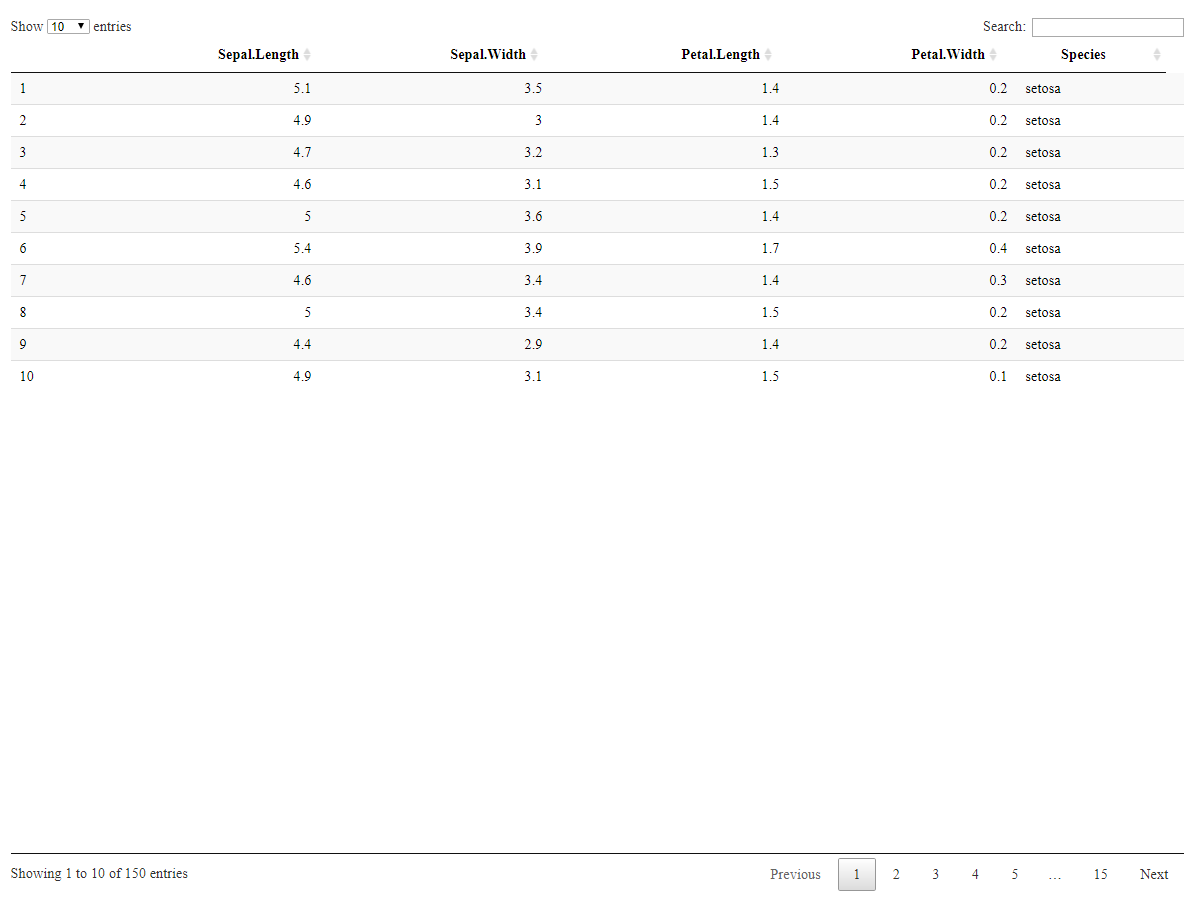
표준 기능 (페이지 넘기기, 정렬, 개수 표시 등) 은 그대로 설명없이 직관적으로 사용할 수 있다. (직접 확인 해보자)
[DT의 기본]
메인 함수는 datatable ()
datatable(data, options = list(), class = "display", callback = JS("return table;"),
          rownames, colnames, container, caption = NULL, filter = c("none", "bottom", "top"),
          escape = TRUE, style = "default", width = "100%", selection = c("multiple", "single", "none"), extensions = list(), plugins = NULL)
data에 matrix와 data frame을 지정한다. 그리고 나머지는 각종 인수로 지정하거나 옵션 및 확장에서 지정한다.
Table 포맷에 대한 정보
해당 표는 html로 출력됨
또한 CSS로 서식을 변경할 수 있다.
그러나 일일이 직접 서식을 지정해 주어야 하기 때문에 다소 번거롭다는 단점이 있음.
class의 활용
대부분의 스타일은 미리 준비되어 있다.
즉 맞추고 싶은 형식을 지정하면 대부분 사용할 수 있다.
즉 아래의 코드를 예시로 든다고 하면...
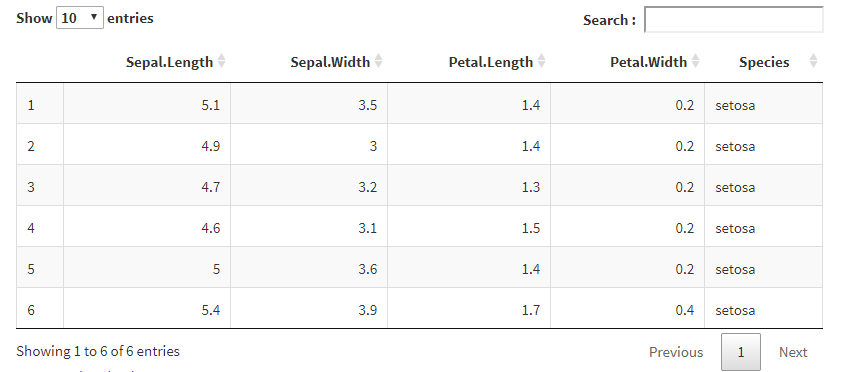
datatable(head(iris), class = 'cell-border stripe')
서식 스타일에 대한 자세한 정보
DT의 default styling option은 아래의 주소에서 확인할 수 있다.
Default styling options
Default styling options Styling your tables to fit perfectly into your site / application, is important to ensure a seamless interface for your end users. The DataTables stylesheet provides a base set of styles to position elements such as the search input
datatables.net
Bootstrap도 가능하다
즉 style='bootstrap'에서 Bootstrap 모드로 들어갈 수 있다.
자세한 내용은 아래 링크를 참조하면 된다.
Bootstrap Styles
When you use style = 'bootstrap' in datatable(), you can specify the CSS classes for Bootstrap tables. You can find the possible classes on this page. We show the appearance of a few classes here: library(DT) iris2 = head(iris, 20) options(DT.options = lis
rstudio.github.io
행 이름의 가시성
기본적으로는 TRUE 이다. (번호로 표시됨)
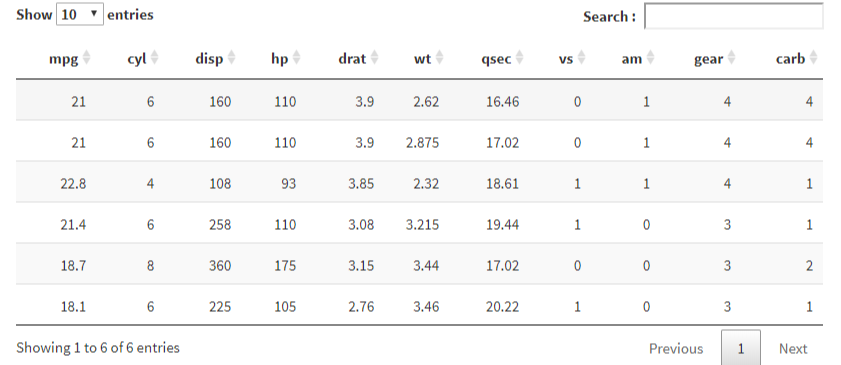
그러나 인수 rownames=FALSE하면 숨기기가 가능하다.
datatable(head(mtcars),rownames = FALSE)
행 이름 재정의
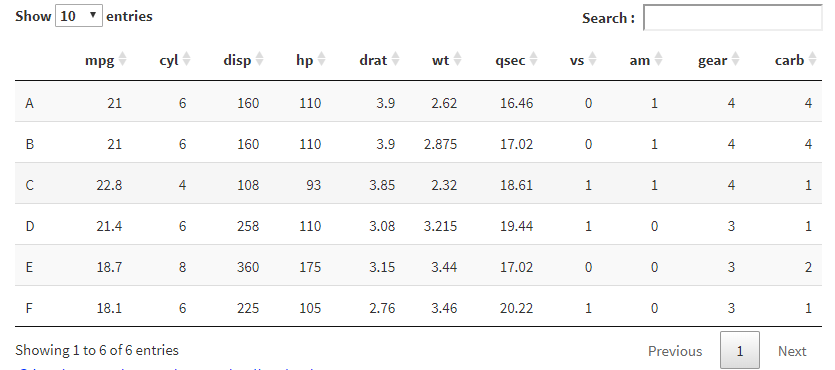
아래의 코드 처럼 다시 재정의 할 수 있다.
datatable(head(mtcars), rownames = head(LETTERS))
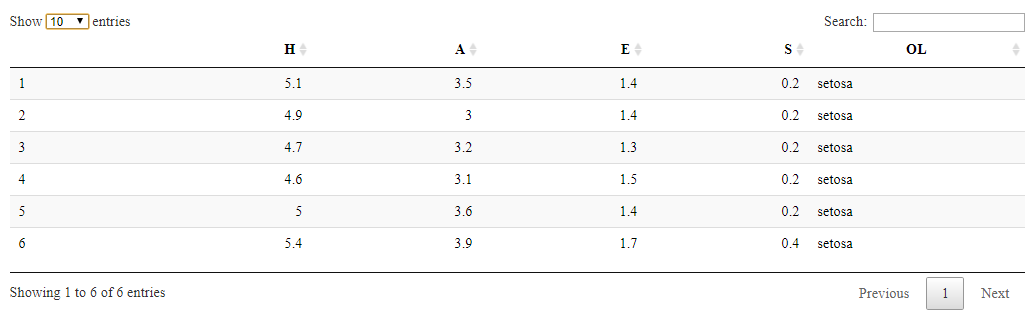
열 이름의 재정의
마찬가지로 열 이름도 재정의가 가능하다.
datatable(head(iris),colnames = c('H','A','E','S','OL'))
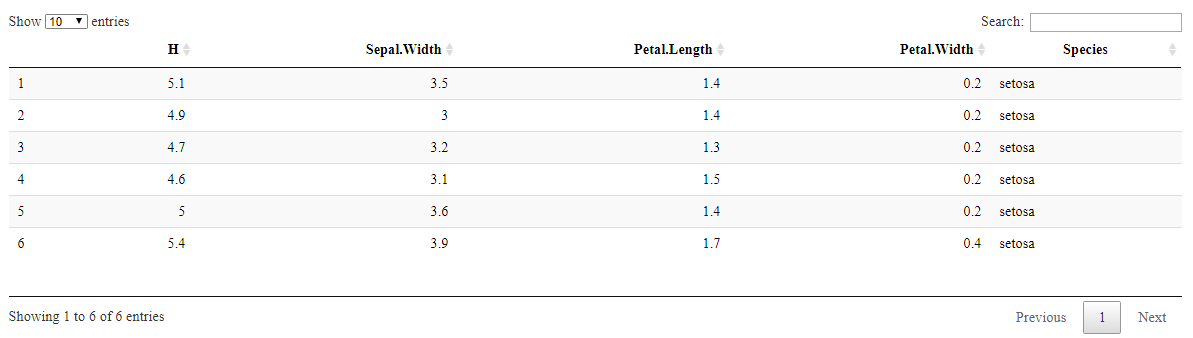
물론 하나만 지정하여 변경하는 것 역시 가능하다.
datatable(head(iris),colnames = c('H'='Sepal.Length'))
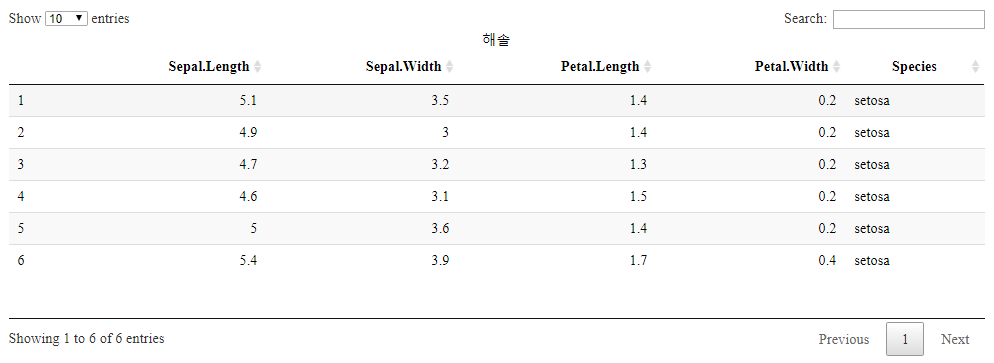
테이블 이름 삽입
caption에서 테이블 이름을 넣을 수 있다.
캡션에 대한 상세한 설정이 가능하지만 본 글에서는 자세한 내용을 생략 (아래의 링크 참조)
Table captions
Friday 7th November, 2014 Table captions There are many under-used, or under-rated, tags in the HTML specification, but one that is of particular interest to us in tabular display is the caption tag. This little known element provides the ability to label
datatables.net
datatable(head(iris), caption = '해솔')
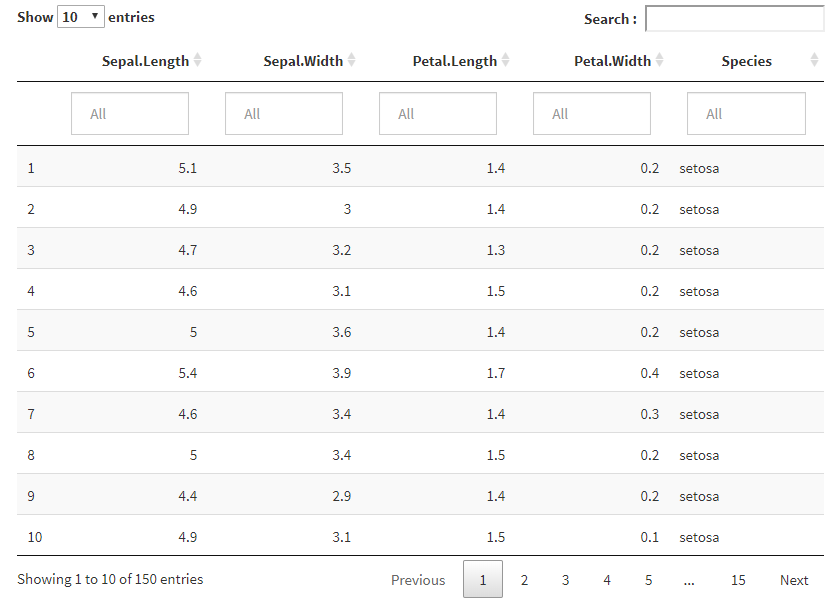
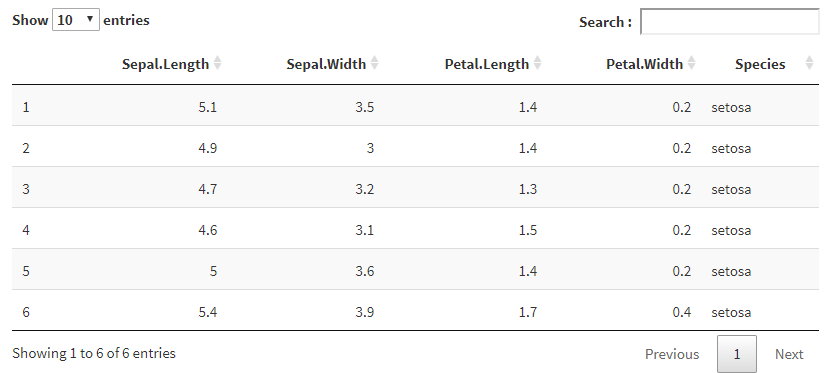
열 필터 기능
각 열 마다 필터링 하는 기능을 넣는것이 가능하다.
datatable(iris,filter = 'top')
만약 factor 형이 내용에 존재하는 경우 선택하는 것도 가능하다.
다만, 이 경우는 옵션에서 수정 해 주어야 하는 부분이 있다.
datatable(iris, filter = 'top',options = list(autoWidth=TRUE))
[옵션 설정]
초기값 설정
초기 값 설정도 여러가지가 있음
표시 할 행 수, 폭 등등..
이들은 option=list(...)으로 지정하고 있음
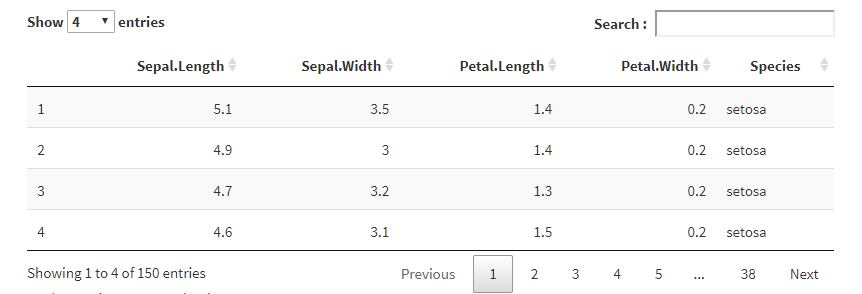
표시할 행 수 지정
예를 들어 options=list(pageLength=4)를 입력하는 경우 4 행만 표시 하도록 지정하는 것
datatable(iris, options = list(pageLength=4))
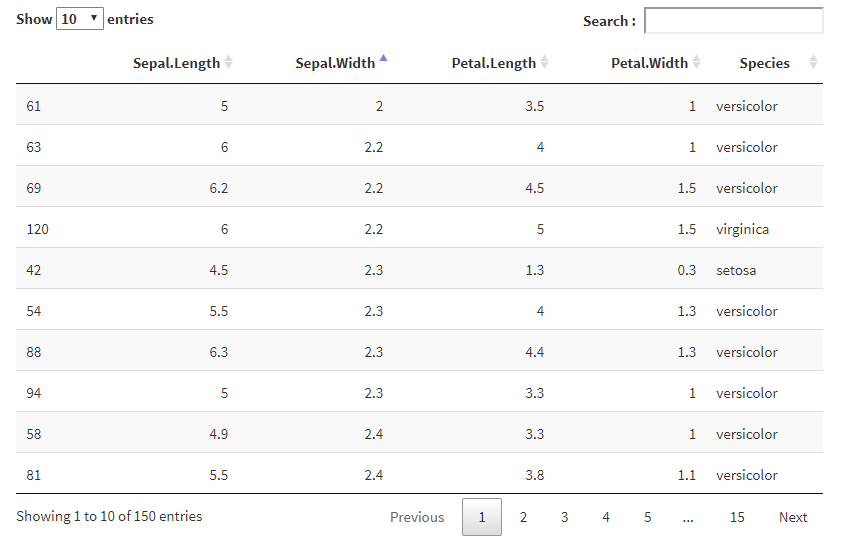
(기본값으로) 정렬
options=list(order=...)로 지정 가능
datatable(iris, options = list(
  order=list(list(2,'asc'))
))
[기타]
extention
extention=...에서 확장 기능을 사용 가능
하지만 할 수 있는 기능이 제한적
의미있는 기능을 하나 소개하자면 열을 마우스 드래그로 이동시키도록 만드는게 가능하다는 것 (직접 해보자)
datatable(head(iris), extensions = 'ColReorder', options = list(dom = 'Rlfrtip'))
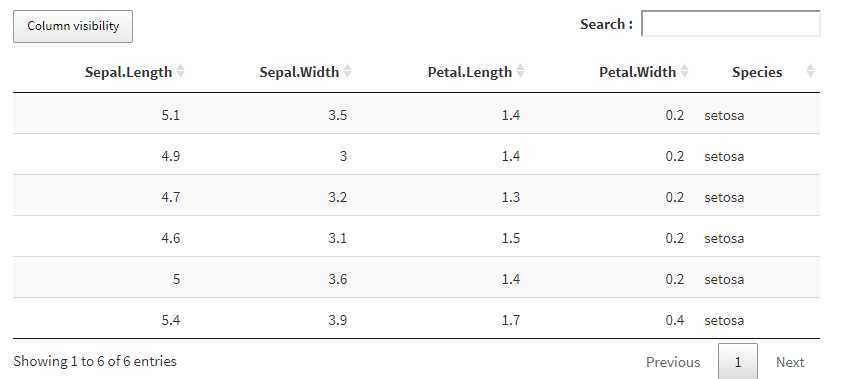
열 가시성 기능
- 버튼을 클릭하여 특정 열을 보이게 하거나 안보이게 만들 수 있다.
datatable(
  head(iris), rownames = FALSE,
  extensions = 'Buttons', options = list(dom = 'Bfrtip', buttons = I('colvis'))
)
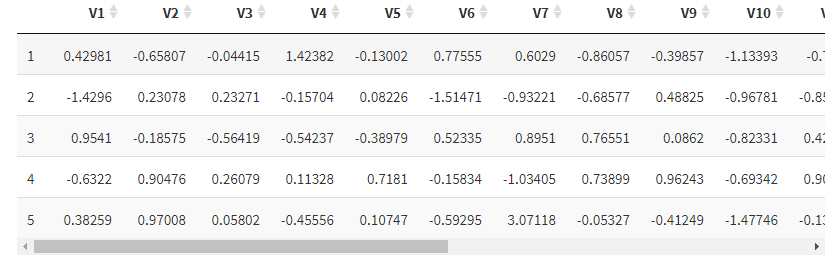
좌우 스크롤 기능
열 수가 많을 때 유용함
m = as.data.frame(round(matrix(rnorm(100), 5), 5))
datatable(
  m, extensions = 'FixedColumns',
  options = list(
    dom = 't',
    scrollX = TRUE,
    scrollCollapse = TRUE
  )
)
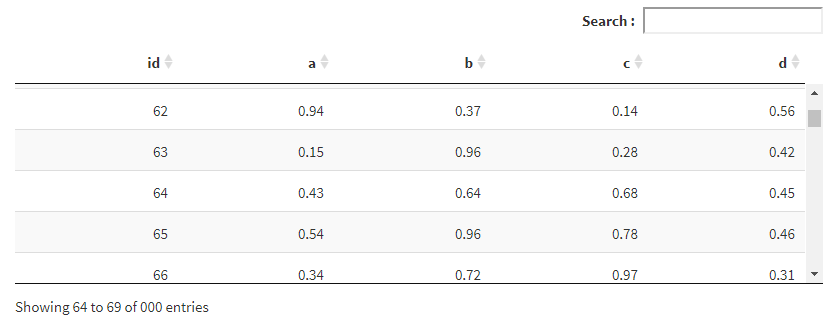
상하 스크롤 기능
상하 스크롤도 가능함
m = matrix(runif(1000 * 4), ncol = 4, dimnames = list(NULL, letters[1:4]))
m = cbind(id = seq_len(nrow(m)), round(m, 2))
datatable(m, extensions = 'Scroller', options = list(
  deferRender = TRUE,
  dom = "frtiS",
  scrollY = 200,
  scrollCollapse = TRUE
))
[더보기]
- 지금까지 소개한 내용은 DT 패키지의 극히 일부분
- 자세한 내용은 공식 사이트 참조
- DT : An R interface to the DataTables library
DT: An R interface to the DataTables library
The R package DT provides an R interface to the JavaScript library DataTables. R data objects (matrices or data frames) can be displayed as tables on HTML pages, and DataTables provides filtering, pagination, sorting, and many other features in the tables.
rstudio.github.io
[전체]
참고 문헌
[논문]
- 없음
[보고서]
- 없음
[URL]
- 없음
문의사항
[기상학/프로그래밍 언어]
- sangho.lee.1990@gmail.com
[해양학/천문학/빅데이터]
- saimang0804@gmail.com
'프로그래밍 언어 > R' 카테고리의 다른 글
| [R] 데이터 분석에서 자주 사용하는 "tidyverse" 패키지 소개 (0) | 2020.02.13 |
|---|---|
| [R] 파일 읽는 GUI를 제공하는 "ezpickr" 패키지 소개 (2) | 2020.02.12 |
| [R] ggplot2에서 텍스트 추가를 위한 "ggfittext" 패키지 소개 (0) | 2020.02.12 |
| [R] 범주형 데이터 (Factor) 를 다루는 "forcast" 패키지 소개 (0) | 2020.02.10 |
| [R] 문자열 조작 "stringr" 패키지 소개 (1) | 2020.02.09 |


최근댓글